Asus 2013 Annual Report Download - page 108
Download and view the complete annual report
Please find page 108 of the 2013 Asus annual report below. You can navigate through the pages in the report by either clicking on the pages listed below, or by using the keyword search tool below to find specific information within the annual report.-
 1
1 -
2
-
3
-
4
-
5
-
6
-
7
-
8
-
9
-
10
-
11
-
12
-
13
-
14
-
15
-
16
-
17
-
18
-
19
-
20
-
21
-
22
-
23
-
24
-
25
-
26
-
27
-
28
-
29
-
30
-
31
-
32
-
33
-
34
-
35
-
36
-
37
-
38
-
39
-
40
-
41
-
42
-
43
-
44
-
45
-
46
-
47
-
48
-
49
-
50
-
51
-
52
-
53
-
54
-
55
-
56
-
57
-
58
-
59
-
60
-
61
-
62
-
63
-
64
-
65
-
66
-
67
-
68
-
69
-
70
-
71
-
72
-
73
-
74
-
75
-
76
-
77
-
78
-
79
-
80
-
81
-
82
-
83
-
84
-
85
-
86
-
87
-
88
-
89
-
90
-
91
-
92
-
93
-
94
-
95
-
96
-
97
-
 98
98 -
 99
99 -
 100
100 -
 101
101 -
 102
102 -
 103
103 -
 104
104 -
 105
105 -
 106
106 -
 107
107 -
 108
108 -
 109
109 -
 110
110 -
 111
111 -
 112
112 -
 113
113 -
 114
114 -
 115
115 -
 116
116 -
 117
117 -
 118
118 -
119
-
120
-
121
-
122
-
123
-
124
-
125
-
126
-
127
-
128
-
129
-
130
-
131
-
132
-
133
-
134
-
135
-
136
-
137
-
138
-
139
-
140
-
141
-
142
-
143
-
144
-
145
-
146
-
147
 |
 |

104
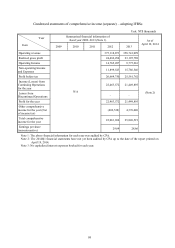
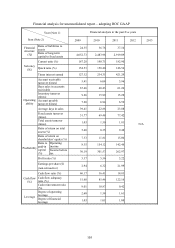
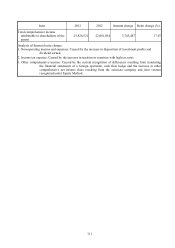
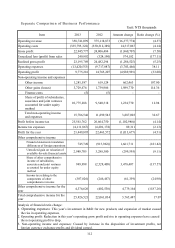
(II) Financial analysis for separate report – adopting IFRSs
Year (Note 1)
Item (Note 3)
Financial analysis in the past five years 當年度截至
103 年4月
19 日財務
資料
2009 2010 2011 2012 2013
Financial
structure
(%)
Ratio of liabilities to
assets
N/A
39.23 38.80
(Note 2)
Ratio of long-term
capital to Property,
plant and equipment
3,148.28 3,044.80
Solvency
(%)
Current ratio (%) 172.09 165.85
Quick ratio (%) 131.49 130.03
Times interest earned 5,332,951.00 5,112,353.40
Operating
ability
Account receivable
turnover (times) 5.98 5.13
Days sales in
accounts receivable 61.03 71.15
Inventory turnover
(times) 13.69 11.66
Account payable
turnover (times) 6.77 6.04
Average days in sales 26.66 31.30
Property, plant and
equipment turnover
(times)
97.82 84.99
Total assets turnover
(times) 1.93 1.68
Profitability
Ratio of return on
total assets (%) 11.58 10.02
Ratio of return on
equity (%) 18.65 16.42
Ratio of profit
before tax to
Paid-in capital (%)
(Note 7)
354.23 344.15
Profit ratio (%) 5.99 5.98
Earnings per share ($)
(non-retroactive)) 29.84 28.66
Cash flow
(%)
Cash flow ratio (%) 20.92 20.87
Cash flow adequacy
ratio (%) 115.09 114.10
Cash reinvestment
ratio (%) 3.70 1.41
Leverage
Degree of operating
leverage 1.34 1.70
Degree of financial
leverage 1.00 1.00
The root causes of the financial ratio change in the last two years:
Cash reinvestment ratio: The current cash dividend amount issued and long-term investment balance increased when
compared with previous period, causing the current cash reinvestment ratio to decline.
Note: The notes are the same as Financial analysis for consolidated report – adopting IFRSs