Asus 2013 Annual Report Download - page 113
Download and view the complete annual report
Please find page 113 of the 2013 Asus annual report below. You can navigate through the pages in the report by either clicking on the pages listed below, or by using the keyword search tool below to find specific information within the annual report.-
 1
1 -
2
-
3
-
4
-
5
-
6
-
7
-
8
-
9
-
10
-
11
-
12
-
13
-
14
-
15
-
16
-
17
-
18
-
19
-
20
-
21
-
22
-
23
-
24
-
25
-
26
-
27
-
28
-
29
-
30
-
31
-
32
-
33
-
34
-
35
-
36
-
37
-
38
-
39
-
40
-
41
-
42
-
43
-
44
-
45
-
46
-
47
-
48
-
49
-
50
-
51
-
52
-
53
-
54
-
55
-
56
-
57
-
58
-
59
-
60
-
61
-
62
-
63
-
64
-
65
-
66
-
67
-
68
-
69
-
70
-
71
-
72
-
73
-
74
-
75
-
76
-
77
-
78
-
79
-
80
-
81
-
82
-
83
-
84
-
85
-
86
-
87
-
88
-
89
-
90
-
91
-
92
-
93
-
94
-
95
-
96
-
97
-
98
-
99
-
100
-
101
-
102
-
 103
103 -
 104
104 -
 105
105 -
 106
106 -
 107
107 -
 108
108 -
 109
109 -
 110
110 -
 111
111 -
 112
112 -
 113
113 -
 114
114 -
 115
115 -
 116
116 -
 117
117 -
 118
118 -
 119
119 -
 120
120 -
 121
121 -
 122
122 -
 123
123 -
124
-
125
-
126
-
127
-
128
-
129
-
130
-
131
-
132
-
133
-
134
-
135
-
136
-
137
-
138
-
139
-
140
-
141
-
142
-
143
-
144
-
145
-
146
-
147
 |
 |

109
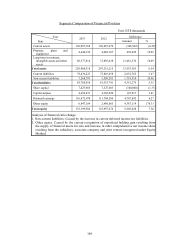
Separate Comparison of Financial Position
Unit: NT$ thousands
Year
Item
2013 2012 Difference
Amount %
Current assets 130,087,168 130,453,670 (366,502) (0.28)
Property, plant and
equipment 4,440,336 4,002,107 438,229 10.95
Long-term investment,
intangible assets and other
assets
86,377,014 72,895,438 13,481,576 18.49
Total assets 220,904,518 207,351,215 13,553,303 6.54
Current liabilities 78,436,223 75,803,458 2,632,765 3.47
Non-current liabilities 7,268,793 5,550,283 1,718,510 30.96
Total liabilities 85,705,016 81,353,741 4,351,275 5.35
Share capital 7,427,603 7,527,603 (100,000) (1.33)
Capital surplus 4,452,237 4,305,220 147,017 3.41
Retained earnings 116,472,478 111,704,586 4,767,892 4.27
Other equity 6,847,184 2,460,065 4,387,119 178.33
Total equity 135,199,502 125,997,474 9,202,028 7.30
Analysis of financial ratio change:
1. Non-current liabilities: Caused by the increase in current deferred income tax liabilities.
2. Other equity: Caused by the current recognition of unrealized holding gain resulting from
the supply of financial assets for sale and increase in other comprehensive net income share
resulting from the subsidiary, associate company and joint venture recognized under Equity
Method.