Asus 2013 Annual Report Download - page 118
Download and view the complete annual report
Please find page 118 of the 2013 Asus annual report below. You can navigate through the pages in the report by either clicking on the pages listed below, or by using the keyword search tool below to find specific information within the annual report.-
 1
1 -
2
-
3
-
4
-
5
-
6
-
7
-
8
-
9
-
10
-
11
-
12
-
13
-
14
-
15
-
16
-
17
-
18
-
19
-
20
-
21
-
22
-
23
-
24
-
25
-
26
-
27
-
28
-
29
-
30
-
31
-
32
-
33
-
34
-
35
-
36
-
37
-
38
-
39
-
40
-
41
-
42
-
43
-
44
-
45
-
46
-
47
-
48
-
49
-
50
-
51
-
52
-
53
-
54
-
55
-
56
-
57
-
58
-
59
-
60
-
61
-
62
-
63
-
64
-
65
-
66
-
67
-
68
-
69
-
70
-
71
-
72
-
73
-
74
-
75
-
76
-
77
-
78
-
79
-
80
-
81
-
82
-
83
-
84
-
85
-
86
-
87
-
88
-
89
-
90
-
91
-
92
-
93
-
94
-
95
-
96
-
97
-
98
-
99
-
100
-
101
-
102
-
103
-
104
-
105
-
106
-
107
-
 108
108 -
 109
109 -
 110
110 -
 111
111 -
 112
112 -
 113
113 -
 114
114 -
 115
115 -
 116
116 -
 117
117 -
 118
118 -
 119
119 -
 120
120 -
 121
121 -
 122
122 -
 123
123 -
 124
124 -
 125
125 -
 126
126 -
 127
127 -
 128
128 -
129
-
130
-
131
-
132
-
133
-
134
-
135
-
136
-
137
-
138
-
139
-
140
-
141
-
142
-
143
-
144
-
145
-
146
-
147
 |
 |

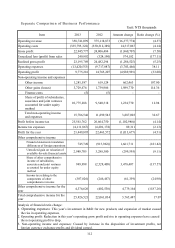
114
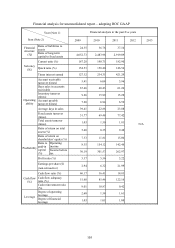
1. Analysis of cash flow change:
(1)Operating activity: Net cash inflow from operating activity for an amount of NT$18
billion
(2)Investing activity: Net cash outflow from investing activity including long-term
investment for an amount of NT$300 million
(3)Financing activity: Net cash outflow from financing activity including dividend
distribution for an amount of NT$14.48 billion
2. Remedial measures for the expected insufficient cash and liquidity analysis: N/A
IV. The impact of significant capital expenditure on finance in recent years:
Significant capital expenditure and the source of fund: N/A
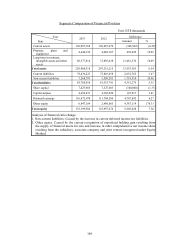
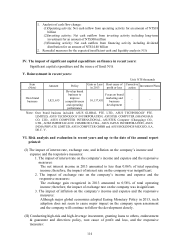
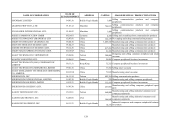
V. Reinvestment in recent years:
Unit: NT$ thousands
Item
(Note) Amount Policy Gain or Loss
in 2013
Root cause of
profit or loss
Corrective
action Investment Plans
Own brand
business 1,821,635
Develop brand
business to
improve
competitiveness
and operating
performance
10,137,451
Focus on brand
marketing and
business
development - -
Note: Own brand business included: ASUS GLOBAL PTE. LTD., ASUS TECHNOLOGY PTE.
LIMITED, ASUS TECHNOLOGY INCORPORATION, ASUSTEK COMPUTER (SHANGHAI)
CO. LTD., ASUS COMPUTER INTERNATIONAL, ASUSTEK Computer (Chongqing) CO.,
LTD., ACBZ IMPORTACAO E COMERCIO LTDA., ASUS JAPAN INCORPORATION, ASUS
INDIA PRIVATE LIMITED, ASUS COMPUTER GMBH and ASUS HOLDINGS MEXICO, S.A.
DE C. V.
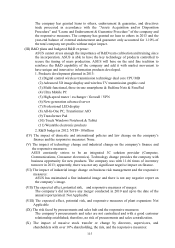
VI. Risk analysis and evaluation in recent years and up to the date of the annual report
printed:
(I) The impact of interest rate, exchange rate, and inflation on the company’s income and
expense and the responsive measures:
1. The impact of interest rate on the company’s income and expense and the responsive
measures:
The net interest income in 2013 amounted to less than 0.06% of total operating
income; therefore, the impact of interest rate on the company was insignificant.
2. The impact of exchange rate on the company’s income and expense and the
responsive measures:
The exchange gain recognized in 2013 amounted to 0.58% of total operating
income; therefore, the impact of exchange rate on the company was insignificant.
3. The impact of inflation on the company’s income and expense and the responsive
measures:
Although major global economies adopted Easing Monetary Policy in 2013, such
adoption does not seem to cause major impact on the company upon assessment
and the company will continue to follow the development closely.
(II) Conducting high-risk and high-leverage investment, granting loans to others, endorsement
& guarantee and directives policy, root cause of profit and loss, and the responsive
measures: