Asus 2013 Annual Report Download - page 97
Download and view the complete annual report
Please find page 97 of the 2013 Asus annual report below. You can navigate through the pages in the report by either clicking on the pages listed below, or by using the keyword search tool below to find specific information within the annual report.-
 1
1 -
2
-
3
-
4
-
5
-
6
-
7
-
8
-
9
-
10
-
11
-
12
-
13
-
14
-
15
-
16
-
17
-
18
-
19
-
20
-
21
-
22
-
23
-
24
-
25
-
26
-
27
-
28
-
29
-
30
-
31
-
32
-
33
-
34
-
35
-
36
-
37
-
38
-
39
-
40
-
41
-
42
-
43
-
44
-
45
-
46
-
47
-
48
-
49
-
50
-
51
-
52
-
53
-
54
-
55
-
56
-
57
-
58
-
59
-
60
-
61
-
62
-
63
-
64
-
65
-
66
-
67
-
68
-
69
-
70
-
71
-
72
-
73
-
74
-
75
-
76
-
77
-
78
-
79
-
80
-
81
-
82
-
83
-
84
-
85
-
86
-
 87
87 -
 88
88 -
 89
89 -
 90
90 -
 91
91 -
 92
92 -
 93
93 -
 94
94 -
 95
95 -
 96
96 -
 97
97 -
 98
98 -
 99
99 -
 100
100 -
 101
101 -
 102
102 -
 103
103 -
 104
104 -
 105
105 -
 106
106 -
 107
107 -
108
-
109
-
110
-
111
-
112
-
113
-
114
-
115
-
116
-
117
-
118
-
119
-
120
-
121
-
122
-
123
-
124
-
125
-
126
-
127
-
128
-
129
-
130
-
131
-
132
-
133
-
134
-
135
-
136
-
137
-
138
-
139
-
140
-
141
-
142
-
143
-
144
-
145
-
146
-
147
 |
 |
93
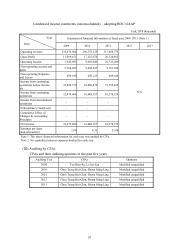
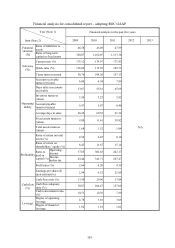
Condensed income statements (consolidated) – adopting ROC GAAP
Unit: NT$ thousands
Year
Item
Summarized financial information of
fiscal year 2009~2013 (Note 1)
2009 2010 2011 2012 2013
Operating revenue 610,120,403 429,721,249 384,112,294
N/A
Gross Profit 62,015,053 51,862,488 52,354,786
Operating Income 15,734,198 18,975,273 18,229,501
Non-operating Income
and gains 6,697,807 4,669,490 3,782,296
Non-operating Expenses
and Losses 3,135,845 2,219,029 1,877,566
Income from continuing
operations before income
Tax
19,296,160 21,425,734 20,134,231
Income from continuing
operations 16,255,535 18,039,603 16,847,398
Income from
discontinued operations - - -
Extraordinary
Gain(Loss) - - -
Cumulative Effect of
Changes In Accounting
Principles
- - -
Consolidated net income 16,255,535 18,039,603 16,847,398
Consolidated net income
attributable to
shareholders of the
parent
12,479,066 16,488,357 16,578,159
Earnings per share
(non-retroactive) 2.94 6.32 21.99
Note 1: The above financial information for each year was audited by CPA.
Note 2: No capitalized interest expenses booked for each year.