Asus 2013 Annual Report Download - page 106
Download and view the complete annual report
Please find page 106 of the 2013 Asus annual report below. You can navigate through the pages in the report by either clicking on the pages listed below, or by using the keyword search tool below to find specific information within the annual report.-
 1
1 -
2
-
3
-
4
-
5
-
6
-
7
-
8
-
9
-
10
-
11
-
12
-
13
-
14
-
15
-
16
-
17
-
18
-
19
-
20
-
21
-
22
-
23
-
24
-
25
-
26
-
27
-
28
-
29
-
30
-
31
-
32
-
33
-
34
-
35
-
36
-
37
-
38
-
39
-
40
-
41
-
42
-
43
-
44
-
45
-
46
-
47
-
48
-
49
-
50
-
51
-
52
-
53
-
54
-
55
-
56
-
57
-
58
-
59
-
60
-
61
-
62
-
63
-
64
-
65
-
66
-
67
-
68
-
69
-
70
-
71
-
72
-
73
-
74
-
75
-
76
-
77
-
78
-
79
-
80
-
81
-
82
-
83
-
84
-
85
-
86
-
87
-
88
-
89
-
90
-
91
-
92
-
93
-
94
-
95
-
 96
96 -
 97
97 -
 98
98 -
 99
99 -
 100
100 -
 101
101 -
 102
102 -
 103
103 -
 104
104 -
 105
105 -
 106
106 -
 107
107 -
 108
108 -
 109
109 -
 110
110 -
 111
111 -
 112
112 -
 113
113 -
 114
114 -
 115
115 -
 116
116 -
117
-
118
-
119
-
120
-
121
-
122
-
123
-
124
-
125
-
126
-
127
-
128
-
129
-
130
-
131
-
132
-
133
-
134
-
135
-
136
-
137
-
138
-
139
-
140
-
141
-
142
-
143
-
144
-
145
-
146
-
147
 |
 |

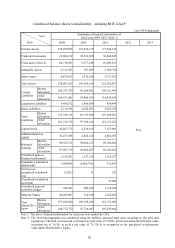
102
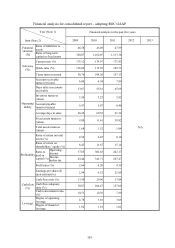
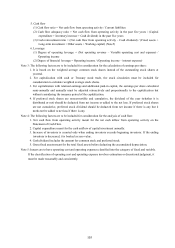
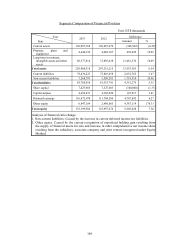
The root causes of the financial ratio change in the last two years:
Times interest earned: At the expiration of current CB, the reduction in amortized value decreased (the CB and
ECB issued by the company does not pay out relevant interests. However, to cooperate with the
regulations of new Financial Reporting, the amortized expense resulting from the discount on
b
onds is recognized as interest expense without the actual cash payout) has caused the interest
protection multiples to increase.
Account receivable turnover (times): The range of decline in average account receivable was higher than that of
operating amount, causing the current account receivable turnover to go up.
Account payable turnover (times): The range of decline in average account payable was higher than that of sale
costs, causing the current account payable to go up.
Fixed assets turnover (times): The decline in current average fixed assets net value caused the current fixed asset
turnover to go up.
Total assets turnover (times): The decline in current average total assets caused the current total assets turnover to
go up.
Ratio of return on total assets (%): The decline in current average total assets caused the ratio of return on total
assets to go up.
Ratio of return on shareholders’ equity: This range of decline in current profit/loss after tax was lower than that of
the decline in average shareholder equity, causing the current ratio of return on shareholders’
equity to go up.
Cash flow ratio: The net cash flow from current operating activities declined while the balance of current liabilities
went up, causing the current cash flow ratio to go down.
Cash flow adequacy ratio (%): The rise in the net cash flow from latet 5 eyars of operating activities caused the
current cash flow adequacy ratio to go up.
Cash reinvestment ratio: The decline net cash flow of current operating activities caused decline in current cash
reinvestment ratio.
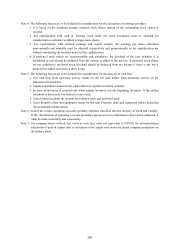
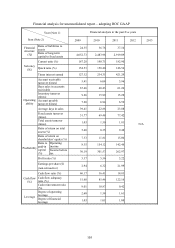
Note 1: The financial information is audited by CPA.
Note 2: Equations:
1. Financial structure
(1) Ratio of liabilities to assets = Total liability/Total assets
(2) Ratio of long-Term capital to fixed assets = (Net shareholders’ equity + Long-term liability) / Net
fixed assets
2. Solvency
(1) Current ratio = Current assets / current liability
(2) Quick ratio = (Current assets – Inventory – Prepaid expense) / Current liability
(3) Times interest earned = Net income before tax and interest expense / Interest expense of the year
3. Operating ability
(1) Account receivable turnover (including accounts receivable and notes receivable derived from
business operation) = Net sales / Average accounts receivable (including accounts receivable and
notes receivable derived from business operation)
(2) Days sales in accounts receivable = 365 / Account receivable turnover
(3) Inventory turnover = Cost of goods sold / Average inventory amount
(4) Account payable turnover (including accounts payable and notes payable derived from business
operation) = Cost of goods sold/ Average accounts payable (including accounts payable and notes
payable derived from business operation)
(5) Average days in sales = 365 / Inventory turnover
(6) Fixed assts turnover = Net sales / Net fixed assets
(7) Total assets turnover = Net sales / Total assets
4. Profitability
(1) Ratio of return on total assets = [Net income (loss) + interest expense x (1-tax rate)] / Average total
assets
(2) Ratio of return on shareholders’ equity = Net income (loss) / Net average shareholders’ equity
(3) Ratio to paid-in capital = Net income before tax / Paid-in capital
(4) Profit ratio = Net income (loss) / Net sales
(5) Earnings per share = (Net income – preferred stock dividend) / Weighted average stock shares issued
(Note4)