Asus 2013 Annual Report Download - page 112
Download and view the complete annual report
Please find page 112 of the 2013 Asus annual report below. You can navigate through the pages in the report by either clicking on the pages listed below, or by using the keyword search tool below to find specific information within the annual report.-
 1
1 -
2
-
3
-
4
-
5
-
6
-
7
-
8
-
9
-
10
-
11
-
12
-
13
-
14
-
15
-
16
-
17
-
18
-
19
-
20
-
21
-
22
-
23
-
24
-
25
-
26
-
27
-
28
-
29
-
30
-
31
-
32
-
33
-
34
-
35
-
36
-
37
-
38
-
39
-
40
-
41
-
42
-
43
-
44
-
45
-
46
-
47
-
48
-
49
-
50
-
51
-
52
-
53
-
54
-
55
-
56
-
57
-
58
-
59
-
60
-
61
-
62
-
63
-
64
-
65
-
66
-
67
-
68
-
69
-
70
-
71
-
72
-
73
-
74
-
75
-
76
-
77
-
78
-
79
-
80
-
81
-
82
-
83
-
84
-
85
-
86
-
87
-
88
-
89
-
90
-
91
-
92
-
93
-
94
-
95
-
96
-
97
-
98
-
99
-
100
-
101
-
 102
102 -
 103
103 -
 104
104 -
 105
105 -
 106
106 -
 107
107 -
 108
108 -
 109
109 -
 110
110 -
 111
111 -
 112
112 -
 113
113 -
 114
114 -
 115
115 -
 116
116 -
 117
117 -
 118
118 -
 119
119 -
 120
120 -
 121
121 -
 122
122 -
123
-
124
-
125
-
126
-
127
-
128
-
129
-
130
-
131
-
132
-
133
-
134
-
135
-
136
-
137
-
138
-
139
-
140
-
141
-
142
-
143
-
144
-
145
-
146
-
147
 |
 |

108
VII. Review of financial position, management performance and
risk management
I. Analysis of financial position
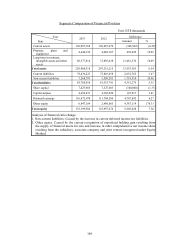
Consolidated Comparison of Financial Position
Unit: NT$ thousands
Year
Item
2012 2011 Difference
Amount %
Current assets 238,864,019 214,271,675 24,592,344 11.48
Property, plant and
equipment 10,746,683 10,764,132 (17,449) (0.16)
Long-term investment,
intangible assets and other
assets
46,462,053 42,997,570 3,464,483 8.06
Total assets 296,072,755 268,033,377 28,039,378 10.46
Current liabilities 151,095,249 134,303,079 16,792,170 12.50
Non-current liabilities 8,006,022 5,942,643 2,063,379 34.72
Total liabilities 159,101,271 140,245,722 18,855,549 13.44
Share capital 7,427,603 7,527,603 (100,000) (1.33)
Capital surplus 4,452,237 4,305,220 147,017 3.41
Retained earnings 116,472,478 111,704,586 4,767,892 4.27
Other equity 6,847,184 2,460,065 4,387,119 178.33
Total equity attributable to
shareholders of the parent 135,199,502 125,997,474 9,202,028 7.30
Total equity 136,971,484 127,787,655 9,183,829 7.19
Analysis of financial ratio change:
1. Non-current liabilities: Caused by the increase in current deferred income tax liabilities.
2. Other equity: Caused by the current recognition of unrealized holding gain resulting from the supply
of financial assets for sale.