Asus 2013 Annual Report Download - page 117
Download and view the complete annual report
Please find page 117 of the 2013 Asus annual report below. You can navigate through the pages in the report by either clicking on the pages listed below, or by using the keyword search tool below to find specific information within the annual report.-
 1
1 -
2
-
3
-
4
-
5
-
6
-
7
-
8
-
9
-
10
-
11
-
12
-
13
-
14
-
15
-
16
-
17
-
18
-
19
-
20
-
21
-
22
-
23
-
24
-
25
-
26
-
27
-
28
-
29
-
30
-
31
-
32
-
33
-
34
-
35
-
36
-
37
-
38
-
39
-
40
-
41
-
42
-
43
-
44
-
45
-
46
-
47
-
48
-
49
-
50
-
51
-
52
-
53
-
54
-
55
-
56
-
57
-
58
-
59
-
60
-
61
-
62
-
63
-
64
-
65
-
66
-
67
-
68
-
69
-
70
-
71
-
72
-
73
-
74
-
75
-
76
-
77
-
78
-
79
-
80
-
81
-
82
-
83
-
84
-
85
-
86
-
87
-
88
-
89
-
90
-
91
-
92
-
93
-
94
-
95
-
96
-
97
-
98
-
99
-
100
-
101
-
102
-
103
-
104
-
105
-
106
-
 107
107 -
 108
108 -
 109
109 -
 110
110 -
 111
111 -
 112
112 -
 113
113 -
 114
114 -
 115
115 -
 116
116 -
 117
117 -
 118
118 -
 119
119 -
 120
120 -
 121
121 -
 122
122 -
 123
123 -
 124
124 -
 125
125 -
 126
126 -
 127
127 -
128
-
129
-
130
-
131
-
132
-
133
-
134
-
135
-
136
-
137
-
138
-
139
-
140
-
141
-
142
-
143
-
144
-
145
-
146
-
147
 |
 |

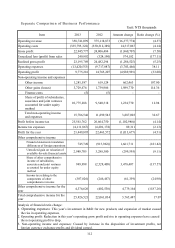
113
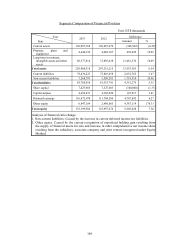
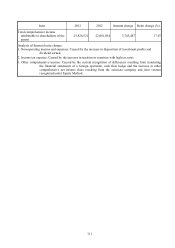
Item 2013 2012 Amount change Ratio change (%)
4. Other comprehensive income: Caused by the current recognition of differences resulting from translating
the financial statements of a foreign operation and the increase in other comprehensive net income share
resulting from the subsidiary, associate company and joint venture recognized under Equity Method.
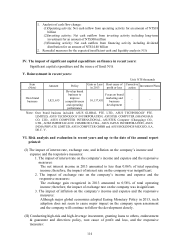
III. Analysis of cash flow
(I) Consolidated liquidity analysis of the last two years
Year
Item
2013 2012 Financial ratio change
Cash flow ratio 19.78% 16.19% 22.17%
Cash flow adequacy ratio 145.59% 130.40% 11.65%
Cash reinvestment ratio 10.03% 7.66% 30.94%
Analysis of financial ratio change:
1. Increase of cash flow ratio this year:
The increase of cash inflow for this year’s operating activities is greater than the
accounts payable and expenses for inbound material inventory as well as other
current liabilities, therefore the cash flow ratio increased.
2. Increase of cash reinvestment ratio this year:
The net cash inflow of this year’s operating activities increased; therefore the cash
reinvestment ratio increased accordingly.
Separate liquidity analysis of the last two years
Year
Item
2013 2012 Financial ratio change
Cash flow ratio 20.87% 20.92% (0.24)%
Cash flow adequacy ratio 114.10% 115.09% (0.86)%
Cash reinvestment ratio 1.41% 3.70% (61.89)%
Analysis of financial ratio change:
Decrease of cash reinvestment ratio this year:
Current cash dividend amount and long-term investment balance increased when compared
with last period, causing the current cash reinvestment ratio to decline.
(II) Analysis of cash liquidity in one year
Unit: NT$100 million
Beginning cash
balance
Expected net
cash flow from
operating activity
of the year
Expected
cash outflow
of the year
Expected cash
surplus
(deficit)
+-
Remedial measures for the
expected insufficient cash
Investing
activity
Financing
activity
242.63 180.04 147.84 274.83 - -