Asus 2013 Annual Report Download - page 66
Download and view the complete annual report
Please find page 66 of the 2013 Asus annual report below. You can navigate through the pages in the report by either clicking on the pages listed below, or by using the keyword search tool below to find specific information within the annual report.-
 1
1 -
2
-
3
-
4
-
5
-
6
-
7
-
8
-
9
-
10
-
11
-
12
-
13
-
14
-
15
-
16
-
17
-
18
-
19
-
20
-
21
-
22
-
23
-
24
-
25
-
26
-
27
-
28
-
29
-
30
-
31
-
32
-
33
-
34
-
35
-
36
-
37
-
38
-
39
-
40
-
41
-
42
-
43
-
44
-
45
-
46
-
47
-
48
-
49
-
50
-
51
-
52
-
53
-
54
-
55
-
 56
56 -
 57
57 -
 58
58 -
 59
59 -
 60
60 -
 61
61 -
 62
62 -
 63
63 -
 64
64 -
 65
65 -
 66
66 -
 67
67 -
 68
68 -
 69
69 -
 70
70 -
 71
71 -
 72
72 -
 73
73 -
 74
74 -
 75
75 -
 76
76 -
77
-
78
-
79
-
80
-
81
-
82
-
83
-
84
-
85
-
86
-
87
-
88
-
89
-
90
-
91
-
92
-
93
-
94
-
95
-
96
-
97
-
98
-
99
-
100
-
101
-
102
-
103
-
104
-
105
-
106
-
107
-
108
-
109
-
110
-
111
-
112
-
113
-
114
-
115
-
116
-
117
-
118
-
119
-
120
-
121
-
122
-
123
-
124
-
125
-
126
-
127
-
128
-
129
-
130
-
131
-
132
-
133
-
134
-
135
-
136
-
137
-
138
-
139
-
140
-
141
-
142
-
143
-
144
-
145
-
146
-
147
 |
 |
62
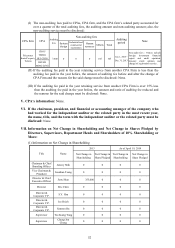
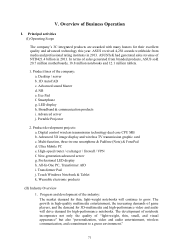
(2) Status of shareholders
Status of Shareholders
April 19, 2014
Status of
shareholders
QTY
Government
Agencies
Financial
Institutions
Other Juridical
Persons
Domestic
Natural
Persons
Foreign
Institutions &
Natural Persons
Total
Number of
Shareholders 6 21 457 117,274 1,287 119,045
Shareholding 7,014 23,663,861 82,131,650 212,811,288 424,146,467 742,760,280
Shareholding ratio (%) 0.00 3.19 11.06 28.65 57.10 100.00
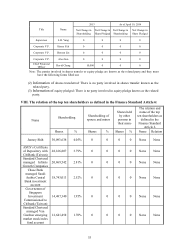
(3) Status of Shareholding Distributed
1. Status of Shareholding Distributed
April 19, 2014
Classification Number of
Shareholder Shareholding Shareholding
Ratio
1- 999 88,462 22,253,675 3.00
1,000- 5,000 25,782 47,393,699 6.38
5,001- 10,000 2,189 15,834,910 2.13
10,001- 15,000 701 8,685,090 1.17
15,001- 20,000 338 6,035,418 0.81
20,001- 30,000 350 8,723,139 1.17%
30,001- 50,000 319 12,615,617 1.68%
50,001- 100,000 333 24,370,128 3.24%
100,001- 200,000 258 37,465,958 4.98%
200,001- 400,000 173 48,683,100 6.47%
400,001- 600,000 64 30,919,811 4.11%
600,001- 800,000 37 25,807,166 3.43%
800,001-1,000,000 20 18,016,867 2.39%
Over 1,000,001 114 452,148,324 60.06%
Total 124,237 752,760,280 100.00%
2. Preferred Stock Shares: None
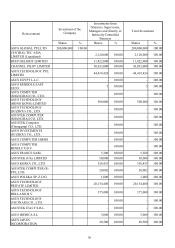
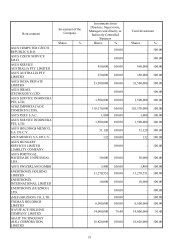
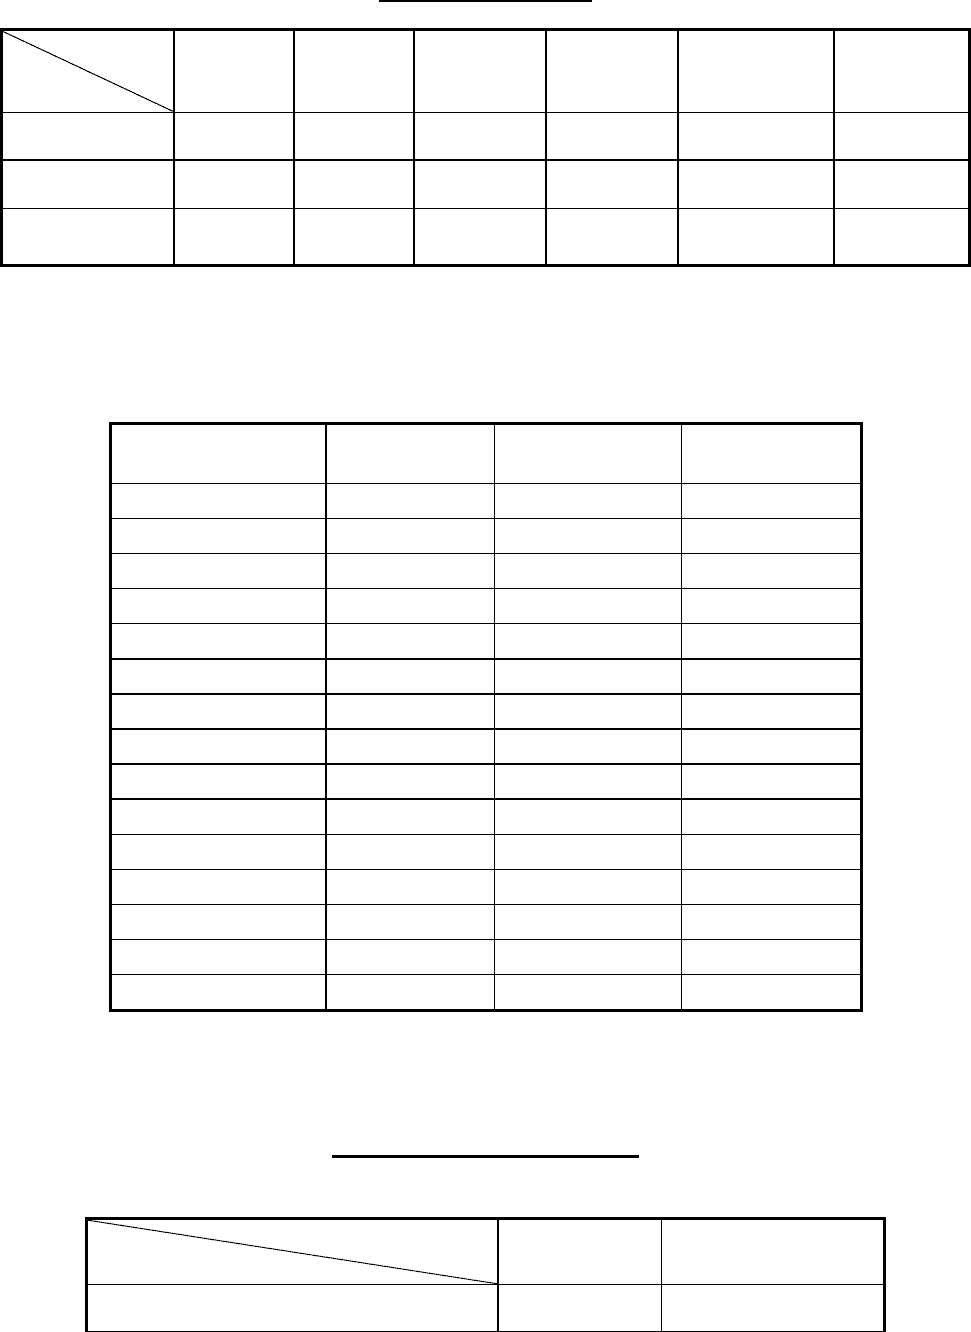
(4) Roster of Major Shareholders
Roster of Major Shareholders
As of April 19, 2014
Shareholding
Shareholder’s Name
Shareholding Shareholding Ratio (%)
Jonney Shih 30,093,638 4.05%