Asus 2013 Annual Report Download - page 94
Download and view the complete annual report
Please find page 94 of the 2013 Asus annual report below. You can navigate through the pages in the report by either clicking on the pages listed below, or by using the keyword search tool below to find specific information within the annual report.-
 1
1 -
2
-
3
-
4
-
5
-
6
-
7
-
8
-
9
-
10
-
11
-
12
-
13
-
14
-
15
-
16
-
17
-
18
-
19
-
20
-
21
-
22
-
23
-
24
-
25
-
26
-
27
-
28
-
29
-
30
-
31
-
32
-
33
-
34
-
35
-
36
-
37
-
38
-
39
-
40
-
41
-
42
-
43
-
44
-
45
-
46
-
47
-
48
-
49
-
50
-
51
-
52
-
53
-
54
-
55
-
56
-
57
-
58
-
59
-
60
-
61
-
62
-
63
-
64
-
65
-
66
-
67
-
68
-
69
-
70
-
71
-
72
-
73
-
74
-
75
-
76
-
77
-
78
-
79
-
80
-
81
-
82
-
83
-
 84
84 -
 85
85 -
 86
86 -
 87
87 -
 88
88 -
 89
89 -
 90
90 -
 91
91 -
 92
92 -
 93
93 -
 94
94 -
 95
95 -
 96
96 -
 97
97 -
 98
98 -
 99
99 -
 100
100 -
 101
101 -
 102
102 -
 103
103 -
 104
104 -
105
-
106
-
107
-
108
-
109
-
110
-
111
-
112
-
113
-
114
-
115
-
116
-
117
-
118
-
119
-
120
-
121
-
122
-
123
-
124
-
125
-
126
-
127
-
128
-
129
-
130
-
131
-
132
-
133
-
134
-
135
-
136
-
137
-
138
-
139
-
140
-
141
-
142
-
143
-
144
-
145
-
146
-
147
 |
 |
90
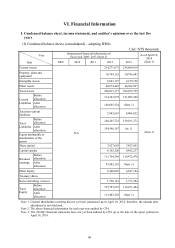
VI. Financial Information
I. Condensed balance sheet, income statement, and auditor’s opinions over the last five
years
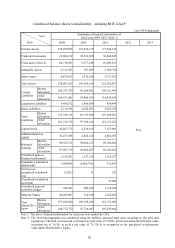
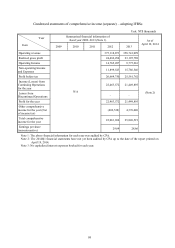
(I) Condensed balance sheets (consolidated) – adopting IFRSs
Unit: NT$ thousands
Year
Item
Summarized financial information of
fiscal year 2009~2013 (Note 2) As of April 19,
2014
(Note 3)
2009 2010 2011 2012 2013
Current Assets
N/A
214,271,675 238,864,019
(Note 3)
Property, plant and
equipment 10,764,132 10,746,683
Intangible Assets 2,023,127 2,159,156
Other Assets 40,974,443 44,302,897
Total Assets 268,033,377 296,072,755
Current
Liabilities
Before
allocation 134,303,079 151,095,249
After
allocation 148,605,524 (Note 1)
Total non-current
liabilities 5,942,643 8,006,022
Total
Liabilities
Before
allocation 140,245,722 159,101,271
After
allocation 154,548,167 (註1)
Equity attributable to
shareholders of the
parent
Share capital 7,527,603 7,427,603
Capital surplus 4,305,220 4,452,237
Retained
earnings
Before
allocation 111,704,586 116,472,478
After
allocation 97,402,141 (Note 1)
Other Equity 2,460,065 6,847,184
Treasury shares - -
Non-controlling interest 1,790,181 1,771,982
Total
Equity
Before
allocation 127,787,655 136,971,484
After
allocation 113,485,210 (Note 1)
Note 1: General shareholders meeting has not yet been summoned up to April 19, 2014; therefore, the amount after
adjustment is not disclosed.
Note 2: The above financial information for each year was audited by CPA.
Note 3: The 2014Q1 financial statements have not yet been audited by CPA up to the date of the report printed on
April 19, 2014.