Asus 2013 Annual Report Download - page 67
Download and view the complete annual report
Please find page 67 of the 2013 Asus annual report below. You can navigate through the pages in the report by either clicking on the pages listed below, or by using the keyword search tool below to find specific information within the annual report.-
 1
1 -
2
-
3
-
4
-
5
-
6
-
7
-
8
-
9
-
10
-
11
-
12
-
13
-
14
-
15
-
16
-
17
-
18
-
19
-
20
-
21
-
22
-
23
-
24
-
25
-
26
-
27
-
28
-
29
-
30
-
31
-
32
-
33
-
34
-
35
-
36
-
37
-
38
-
39
-
40
-
41
-
42
-
43
-
44
-
45
-
46
-
47
-
48
-
49
-
50
-
51
-
52
-
53
-
54
-
55
-
56
-
 57
57 -
 58
58 -
 59
59 -
 60
60 -
 61
61 -
 62
62 -
 63
63 -
 64
64 -
 65
65 -
 66
66 -
 67
67 -
 68
68 -
 69
69 -
 70
70 -
 71
71 -
 72
72 -
 73
73 -
 74
74 -
 75
75 -
 76
76 -
 77
77 -
78
-
79
-
80
-
81
-
82
-
83
-
84
-
85
-
86
-
87
-
88
-
89
-
90
-
91
-
92
-
93
-
94
-
95
-
96
-
97
-
98
-
99
-
100
-
101
-
102
-
103
-
104
-
105
-
106
-
107
-
108
-
109
-
110
-
111
-
112
-
113
-
114
-
115
-
116
-
117
-
118
-
119
-
120
-
121
-
122
-
123
-
124
-
125
-
126
-
127
-
128
-
129
-
130
-
131
-
132
-
133
-
134
-
135
-
136
-
137
-
138
-
139
-
140
-
141
-
142
-
143
-
144
-
145
-
146
-
147
 |
 |

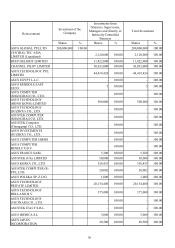
63
Shareholding
Shareholder’s Name
Shareholding Shareholding Ratio (%)
ASUS’s Certificate of Depository with CitiBank
(Taiwan) 28,166,807 3.79%
Standard Chartered managed Infinite Growth
Companies 20,869,542 2.81%
Chase Bank managed Saudi Arabia Central Bank
investment account 18,743,013 2.52%
Governemnt of Singapore Investment
Commissioned to Citibank (Taiwan) 14,487,340 1.95%
Standard Chartered managed Van Gardner
emerging market stock index fund account 12,641,458 1.70%
Labor Insurance Funds 11,939,040 1.61%
ASUS’s Royal Bank of Scotland FS Pacific
Investment Account with CitiBank 10,548,000 1.42%
Invesco Greater China Equity Fund with JPM
Invesco Funds 9,715,000 1.31%
Abu Dhabi Investment Authority Account with
JPMorgan Chase & Co., 8,925,613 1.20%
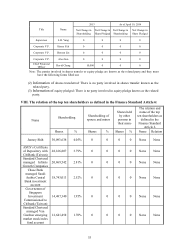
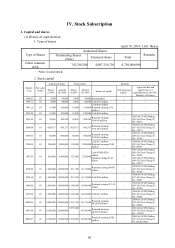
(5) Market Price, Net Worth, Earnings & Dividend per Share of the Last Two Years
Market Price, Net Worth, Earnings & Dividend per Share
Unit: NT$/Share
Fiscal year
Item 2012 2013
As of March 31,
2014 (Note 9)
Market price per
share
(Note 1) (Note 3)
Max. 342 382 304
Min. 212 204 267
Average 287.28 288.64 287.35
Net worth per
share (Note 2)
Before appropriation 167.38 182.02 -
After appropriation 148.38 (Note 8)
Earnings per share
Weighted average shares
(Note 3)
752,760
thousand
shares
748,395
thousand
shares
-
Earnings per
shares (Note 3)
Before adjustment 29.84 28.66 -
After adjustment 29.84 (Note 8)
Dividends per
share
Cash dividends 19.00 (Note 8) -
Stock
dividends
Stock dividends
from Retained
earnings
0(Note 8) -
Stock dividends
from Additional
paid-in capital
0(Note 8) -
Accumulated unpaid dividends
(Note 4) - - -
Analysis of return
on investment
Price/Earning Ratio (Note 5) 9.63 10.07 -
Price/Dividend Ratio (Note 6) 15.12 (Note 8) -
Cash dividends yield rate (Note 7) 6.61%(Note 8) -
Note 1: List the highest and lowest market price per share; also, calculate the average market price per share in accordance
with the trade amount and shares.
Note 2: Please base the information on the shares issued at yearned and the resolution for stock distribution in shareholders
meeting. Re-calculated according to IFRS.
Note 3: If the stock dividend is to be adjusted retroactively, please list the earnings per share before and after the