Allstate 2015 Annual Report Download - page 96
Download and view the complete annual report
Please find page 96 of the 2015 Allstate annual report below. You can navigate through the pages in the report by either clicking on the pages listed below, or by using the keyword search tool below to find specific information within the annual report.-
 1
1 -
2
-
3
-
4
-
5
-
6
-
7
-
8
-
9
-
10
-
11
-
12
-
13
-
14
-
15
-
16
-
17
-
18
-
19
-
20
-
21
-
22
-
23
-
24
-
25
-
26
-
27
-
28
-
29
-
30
-
31
-
32
-
33
-
34
-
35
-
36
-
37
-
38
-
39
-
40
-
41
-
42
-
43
-
44
-
45
-
46
-
47
-
48
-
49
-
50
-
51
-
52
-
53
-
54
-
55
-
56
-
57
-
58
-
59
-
60
-
61
-
62
-
63
-
64
-
65
-
66
-
67
-
68
-
69
-
70
-
71
-
72
-
73
-
74
-
75
-
76
-
77
-
78
-
79
-
80
-
81
-
82
-
83
-
84
-
85
-
 86
86 -
 87
87 -
 88
88 -
 89
89 -
 90
90 -
 91
91 -
 92
92 -
 93
93 -
 94
94 -
 95
95 -
 96
96 -
 97
97 -
 98
98 -
 99
99 -
 100
100 -
 101
101 -
 102
102 -
 103
103 -
 104
104 -
 105
105 -
 106
106 -
107
-
108
-
109
-
110
-
111
-
112
-
113
-
114
-
115
-
116
-
117
-
118
-
119
-
120
-
121
-
122
-
123
-
124
-
125
-
126
-
127
-
128
-
129
-
130
-
131
-
132
-
133
-
134
-
135
-
136
-
137
-
138
-
139
-
140
-
141
-
142
-
143
-
144
-
145
-
146
-
147
-
148
-
149
-
150
-
151
-
152
-
153
-
154
-
155
-
156
-
157
-
158
-
159
-
160
-
161
-
162
-
163
-
164
-
165
-
166
-
167
-
168
-
169
-
170
-
171
-
172
-
173
-
174
-
175
-
176
-
177
-
178
-
179
-
180
-
181
-
182
-
183
-
184
-
185
-
186
-
187
-
188
-
189
-
190
-
191
-
192
-
193
-
194
-
195
-
196
-
197
-
198
-
199
-
200
-
201
-
202
-
203
-
204
-
205
-
206
-
207
-
208
-
209
-
210
-
211
-
212
-
213
-
214
-
215
-
216
-
217
-
218
-
219
-
220
-
221
-
222
-
223
-
224
-
225
-
226
-
227
-
228
-
229
-
230
-
231
-
232
-
233
-
234
-
235
-
236
-
237
-
238
-
239
-
240
-
241
-
242
-
243
-
244
-
245
-
246
-
247
-
248
-
249
-
250
-
251
-
252
-
253
-
254
-
255
-
256
-
257
-
258
-
259
-
260
-
261
-
262
-
263
-
264
-
265
-
266
-
267
-
268
-
269
-
270
-
271
-
272
 |
 |
90 www.allstate.com
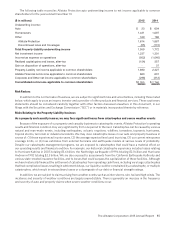
The amount and timing of net investment income from our performance-based long-term investments, including
private equity, real estate, infrastructure, timber and agriculture-related assets, tends to be uneven as a result of the
performance of the underlying investments. The timing of distributions depends on particular events, schedules for
making distributions, and cash needs related to the investments. As a result, the amount of net investment income
from these investments can vary substantially from quarter to quarter. Significant volatility could adversely impact net
investment income and returns on these investments. In addition, the valuation of such investments may be impacted
by market downturns or volatility.
The determination of the amount of realized capital losses recorded for impairments of our investments is
subjective and could materially impact our operating results and financial condition
The determination of the amount of realized capital losses recorded for impairments vary by investment type and
is based upon our ongoing evaluation and assessment of known and inherent risks associated with the respective asset
class. Such evaluations and assessments are revised as conditions change and new information becomes available. We
update our evaluations regularly and reflect changes in other-than-temporary impairments in our results of operations.
The assessment of whether other-than-temporary impairments have occurred is based on our case-by-case evaluation
of the underlying reasons for the decline in fair value. Our conclusions on such assessments are judgmental and include
assumptions and projections of future cash flows and price recovery which may ultimately prove to be incorrect as
assumptions, facts and circumstances change. Furthermore, historical trends may not be indicative of future impairments
and additional impairments may need to be recorded in the future.
The determination of the fair value of our fixed income and equity securities is subjective and could materially
impact our operating results and financial condition
In determining fair values we principally use the market approach which utilizes market transaction data for the same
or similar instruments. The degree of judgment involved in determining fair values is inversely related to the availability
of market observable information. The fair value of assets may differ from the actual amount received upon sale of an
asset in an orderly transaction between market participants at the measurement date. Moreover, the use of different
valuation assumptions may have a material effect on the assets’ fair values. The difference between amortized cost
or cost and fair value, net of deferred income taxes and related life and annuity DAC, deferred sales inducement costs
and reserves for life-contingent contract benefits, is reflected as a component of accumulated other comprehensive
income in shareholders’ equity. Changing market conditions could materially affect the determination of the fair value of
securities and unrealized net capital gains and losses could vary significantly.
Risks Relating to the Insurance Industry
Our future growth and profitability are dependent in part on our ability to successfully operate in an insurance
industry that is highly competitive
The insurance industry is highly competitive. Many of our primary insurance competitors have well-established
national reputations and market similar products.
We have invested in growth strategies by utilizing unique customer value propositions for each of our brands,
differentiated product offerings and distinctive advertising campaigns. If we are unsuccessful in generating new business
and retaining a sufficient number of customers, our ability to increase premiums written could be impacted. In addition,
if we experience unexpected increases in underlying costs (such as the frequency or severity of claims costs), it could
result in decreases in profitability and lead to price increases which could negatively impact our competitive position.
We are also investing in telematics and broadening the value proposition for the connected consumer. If we are not
effective in anticipating the impact on our business of changing technology, including automotive technology, our ability
to successfully operate may be impaired. Also, telematics devices used have been identified as a potential means for
an unauthorized person to connect with a vehicle’s computer system resulting in theft or damage, which could affect
our ability to successfully use these technologies. Other potential technological changes, such as driverless cars or
technologies that facilitate ride or home sharing, could disrupt the demand for our products from current customers,
create coverage issues or impact the frequency or severity of losses, and we may not be able to respond effectively.
Because of the competitive nature of the insurance industry, there can be no assurance that we will continue to
effectively compete with our industry rivals, or that competitive pressures will not have a material effect on our business,
operating results or financial condition. This includes competition for producers such as exclusive and independent
agents and their licensed sales professionals. In the event we are unable to attract and retain these producers, they are
unable to attract and retain their licensed sales professionals, or they are unable to attract and retain customers for our
products, growth and retention could be materially affected. Furthermore, certain competitors operate using a mutual