Allstate 2015 Annual Report Download - page 123
Download and view the complete annual report
Please find page 123 of the 2015 Allstate annual report below. You can navigate through the pages in the report by either clicking on the pages listed below, or by using the keyword search tool below to find specific information within the annual report.-
 1
1 -
2
-
3
-
4
-
5
-
6
-
7
-
8
-
9
-
10
-
11
-
12
-
13
-
14
-
15
-
16
-
17
-
18
-
19
-
20
-
21
-
22
-
23
-
24
-
25
-
26
-
27
-
28
-
29
-
30
-
31
-
32
-
33
-
34
-
35
-
36
-
37
-
38
-
39
-
40
-
41
-
42
-
43
-
44
-
45
-
46
-
47
-
48
-
49
-
50
-
51
-
52
-
53
-
54
-
55
-
56
-
57
-
58
-
59
-
60
-
61
-
62
-
63
-
64
-
65
-
66
-
67
-
68
-
69
-
70
-
71
-
72
-
73
-
74
-
75
-
76
-
77
-
78
-
79
-
80
-
81
-
82
-
83
-
84
-
85
-
86
-
87
-
88
-
89
-
90
-
91
-
92
-
93
-
94
-
95
-
96
-
97
-
98
-
99
-
100
-
101
-
102
-
103
-
104
-
105
-
106
-
107
-
108
-
109
-
110
-
111
-
112
-
 113
113 -
 114
114 -
 115
115 -
 116
116 -
 117
117 -
 118
118 -
 119
119 -
 120
120 -
 121
121 -
 122
122 -
 123
123 -
 124
124 -
 125
125 -
 126
126 -
 127
127 -
 128
128 -
 129
129 -
 130
130 -
 131
131 -
 132
132 -
 133
133 -
134
-
135
-
136
-
137
-
138
-
139
-
140
-
141
-
142
-
143
-
144
-
145
-
146
-
147
-
148
-
149
-
150
-
151
-
152
-
153
-
154
-
155
-
156
-
157
-
158
-
159
-
160
-
161
-
162
-
163
-
164
-
165
-
166
-
167
-
168
-
169
-
170
-
171
-
172
-
173
-
174
-
175
-
176
-
177
-
178
-
179
-
180
-
181
-
182
-
183
-
184
-
185
-
186
-
187
-
188
-
189
-
190
-
191
-
192
-
193
-
194
-
195
-
196
-
197
-
198
-
199
-
200
-
201
-
202
-
203
-
204
-
205
-
206
-
207
-
208
-
209
-
210
-
211
-
212
-
213
-
214
-
215
-
216
-
217
-
218
-
219
-
220
-
221
-
222
-
223
-
224
-
225
-
226
-
227
-
228
-
229
-
230
-
231
-
232
-
233
-
234
-
235
-
236
-
237
-
238
-
239
-
240
-
241
-
242
-
243
-
244
-
245
-
246
-
247
-
248
-
249
-
250
-
251
-
252
-
253
-
254
-
255
-
256
-
257
-
258
-
259
-
260
-
261
-
262
-
263
-
264
-
265
-
266
-
267
-
268
-
269
-
270
-
271
-
272
 |
 |

The Allstate Corporation 2015 Annual Report 117
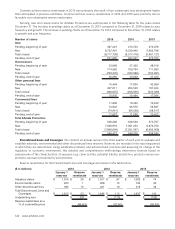
DISCONTINUED LINES AND COVERAGES SEGMENT
Overview The Discontinued Lines and Coverages segment includes results from property-liability insurance coverage
that we no longer write and results for certain commercial and other businesses in run-off. Our exposure to asbestos,
environmental and other discontinued lines claims is reported in this segment. We have assigned management of
this segment to a designated group of professionals with expertise in claims handling, policy coverage interpretation,
exposure identification and reinsurance collection. As part of its responsibilities, this group may at times be engaged in
policy buybacks, settlements and reinsurance assumed and ceded commutations.
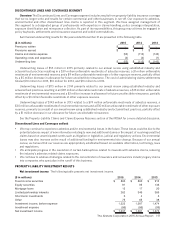
Summarized underwriting results for the years ended December 31 are presented in the following table.
($ in millions) 2015 2014 2013
Premiums written $ — $ 1 $ —
Premiums earned $ — $ 1 $ —
Claims and claims expense (53) (113) (142)
Operating costs and expenses (2) (3) (1)
Underwriting loss $ (55) $ (115) $ (143)
Underwriting losses of $55 million in 2015 primarily related to our annual review using established industry and
actuarial best practices resulting in a $39 million unfavorable reestimate of asbestos reserves, a $1 million unfavorable
reestimate of environmental reserves and a $9 million unfavorable reestimate of other exposure reserves, partially offset
by a $5 million decrease in allowance for future uncollectible reinsurance. The cost of administering claims settlements
totaled $10 million for 2015, $10 million for 2014, and $13 million for 2013.
Underwriting losses of $115 million in 2014 primarily related to our annual review using established industry and
actuarial best practices resulting in an $87 million unfavorable reestimate of asbestos reserves, a $15 million unfavorable
reestimate of environmental reserves and a $3 million increase in allowance for future uncollectible reinsurance, partially
offset by a $3 million favorable reestimate of other exposure reserves.
Underwriting losses of $143 million in 2013 related to a $74 million unfavorable reestimate of asbestos reserves, a
$30 million unfavorable reestimate of environmental reserves and a $30 million unfavorable reestimate of other exposure
reserves, primarily as a result of our annual review using established industry and actuarial best practices, partially offset
by a $1 million decrease in our allowance for future uncollectable reinsurance.
See the Property-Liability Claims and Claims Expense Reserves section of the MD&A for a more detailed discussion.
Discontinued Lines and Coverages outlook
• We may continue to experience asbestos and/or environmental losses in the future. These losses could be due to the
potential adverse impact of new information relating to new and additional claims or the impact of resolving unsettled
claims based on unanticipated events such as litigation or legislative, judicial and regulatory actions. Environmental
losses may also increase as the result of additional funding for environmental site cleanup. Because of our annual
review, we believe that our reserves are appropriately established based on available information, technology, laws
and regulations.
• We anticipate progress in the resolution of certain bankruptcies related to insureds with asbestos claims, reducing
the industry’s asbestos related claims exposures.
• We continue to address challenges related to the concentration of insurance and reinsurance industry legacy claims
into companies who specialize in the runoff of this business.
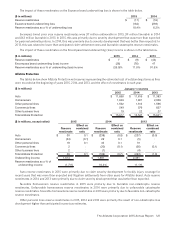
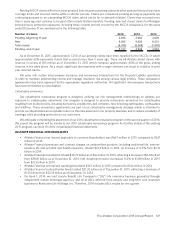
PROPERTY-LIABILITY INVESTMENT RESULTS
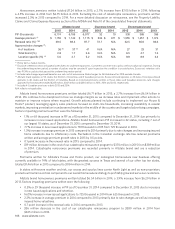
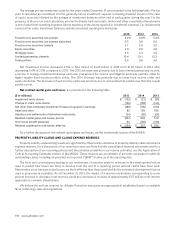
Net investment income The following table presents net investment income.
($ in millions) 2015 2014 2013
Fixed income securities $ 885 $ 860 $ 912
Equity securities 81 95 136
Mortgage loans 15 17 20
Limited partnership interests 262 346 365
Short‑term investments 5 4 3
Other 75 65 38
Investment income, before expense 1,323 1,387 1,474
Investment expense (86) (86) (99)
Net investment income $ 1,237 $ 1,301 $ 1,375