Allstate 2015 Annual Report Download - page 200
Download and view the complete annual report
Please find page 200 of the 2015 Allstate annual report below. You can navigate through the pages in the report by either clicking on the pages listed below, or by using the keyword search tool below to find specific information within the annual report.-
 1
1 -
2
-
3
-
4
-
5
-
6
-
7
-
8
-
9
-
10
-
11
-
12
-
13
-
14
-
15
-
16
-
17
-
18
-
19
-
20
-
21
-
22
-
23
-
24
-
25
-
26
-
27
-
28
-
29
-
30
-
31
-
32
-
33
-
34
-
35
-
36
-
37
-
38
-
39
-
40
-
41
-
42
-
43
-
44
-
45
-
46
-
47
-
48
-
49
-
50
-
51
-
52
-
53
-
54
-
55
-
56
-
57
-
58
-
59
-
60
-
61
-
62
-
63
-
64
-
65
-
66
-
67
-
68
-
69
-
70
-
71
-
72
-
73
-
74
-
75
-
76
-
77
-
78
-
79
-
80
-
81
-
82
-
83
-
84
-
85
-
86
-
87
-
88
-
89
-
90
-
91
-
92
-
93
-
94
-
95
-
96
-
97
-
98
-
99
-
100
-
101
-
102
-
103
-
104
-
105
-
106
-
107
-
108
-
109
-
110
-
111
-
112
-
113
-
114
-
115
-
116
-
117
-
118
-
119
-
120
-
121
-
122
-
123
-
124
-
125
-
126
-
127
-
128
-
129
-
130
-
131
-
132
-
133
-
134
-
135
-
136
-
137
-
138
-
139
-
140
-
141
-
142
-
143
-
144
-
145
-
146
-
147
-
148
-
149
-
150
-
151
-
152
-
153
-
154
-
155
-
156
-
157
-
158
-
159
-
160
-
161
-
162
-
163
-
164
-
165
-
166
-
167
-
168
-
169
-
170
-
171
-
172
-
173
-
174
-
175
-
176
-
177
-
178
-
179
-
180
-
181
-
182
-
183
-
184
-
185
-
186
-
187
-
188
-
189
-
 190
190 -
 191
191 -
 192
192 -
 193
193 -
 194
194 -
 195
195 -
 196
196 -
 197
197 -
 198
198 -
 199
199 -
 200
200 -
 201
201 -
 202
202 -
 203
203 -
 204
204 -
 205
205 -
 206
206 -
 207
207 -
 208
208 -
 209
209 -
 210
210 -
211
-
212
-
213
-
214
-
215
-
216
-
217
-
218
-
219
-
220
-
221
-
222
-
223
-
224
-
225
-
226
-
227
-
228
-
229
-
230
-
231
-
232
-
233
-
234
-
235
-
236
-
237
-
238
-
239
-
240
-
241
-
242
-
243
-
244
-
245
-
246
-
247
-
248
-
249
-
250
-
251
-
252
-
253
-
254
-
255
-
256
-
257
-
258
-
259
-
260
-
261
-
262
-
263
-
264
-
265
-
266
-
267
-
268
-
269
-
270
-
271
-
272
 |
 |

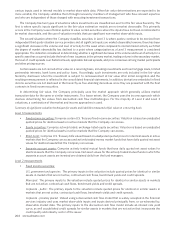
194 www.allstate.com
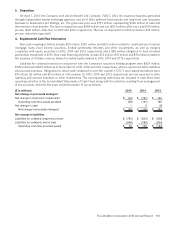
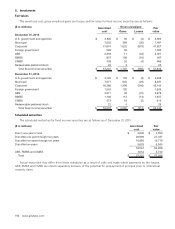
5. Investments
Fair values
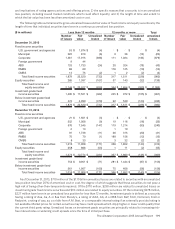
The amortized cost, gross unrealized gains and losses and fair value for fixed income securities are as follows:
($ in millions) Amortized
cost
Gross unrealized Fair
valueGains Losses
December 31, 2015
U.S. government and agencies $ 3,836 $ 90 $ (4) $ 3,922
Municipal 7,032 389 (20) 7,401
Corporate 41,674 1,032 (879) 41,827
Foreign government 983 50 — 1,033
ABS 2,359 11 (43) 2,327
RMBS 857 100 (10) 947
CMBS 438 32 (4) 466
Redeemable preferred stock 22 3 — 25
Total fixed income securities $ 57,201 $ 1,707 $ (960) $ 57,948
December 31, 2014
U.S. government and agencies $ 4,192 $ 139 $ (3) $ 4,328
Municipal 7,877 645 (25) 8,497
Corporate 40,386 1,998 (240) 42,144
Foreign government 1,543 102 — 1,645
ABS 3,971 38 (31) 3,978
RMBS 1,108 112 (13) 1,207
CMBS 573 44 (2) 615
Redeemable preferred stock 22 4 — 26
Total fixed income securities $ 59,672 $ 3,082 $ (314) $ 62,440
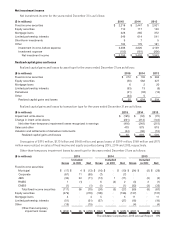
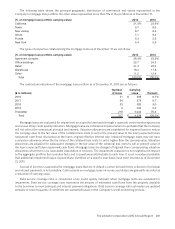
Scheduled maturities
The scheduled maturities for fixed income securities are as follows as of December 31, 2015:
($ in millions) Amortized
cost
Fair
value
Due in one year or less $ 4,030 $ 4,050
Due after one year through five years 26,999 27,337
Due after five years through ten years 16,885 16,778
Due after ten years 5,633 6,043
53,547 54,208
ABS, RMBS and CMBS 3,654 3,740
Total $ 57,201 $ 57,948
Actual maturities may differ from those scheduled as a result of calls and make-whole payments by the issuers.
ABS, RMBS and CMBS are shown separately because of the potential for prepayment of principal prior to contractual
maturity dates.