Allstate 2015 Annual Report Download - page 140
Download and view the complete annual report
Please find page 140 of the 2015 Allstate annual report below. You can navigate through the pages in the report by either clicking on the pages listed below, or by using the keyword search tool below to find specific information within the annual report.-
 1
1 -
2
-
3
-
4
-
5
-
6
-
7
-
8
-
9
-
10
-
11
-
12
-
13
-
14
-
15
-
16
-
17
-
18
-
19
-
20
-
21
-
22
-
23
-
24
-
25
-
26
-
27
-
28
-
29
-
30
-
31
-
32
-
33
-
34
-
35
-
36
-
37
-
38
-
39
-
40
-
41
-
42
-
43
-
44
-
45
-
46
-
47
-
48
-
49
-
50
-
51
-
52
-
53
-
54
-
55
-
56
-
57
-
58
-
59
-
60
-
61
-
62
-
63
-
64
-
65
-
66
-
67
-
68
-
69
-
70
-
71
-
72
-
73
-
74
-
75
-
76
-
77
-
78
-
79
-
80
-
81
-
82
-
83
-
84
-
85
-
86
-
87
-
88
-
89
-
90
-
91
-
92
-
93
-
94
-
95
-
96
-
97
-
98
-
99
-
100
-
101
-
102
-
103
-
104
-
105
-
106
-
107
-
108
-
109
-
110
-
111
-
112
-
113
-
114
-
115
-
116
-
117
-
118
-
119
-
120
-
121
-
122
-
123
-
124
-
125
-
126
-
127
-
128
-
129
-
 130
130 -
 131
131 -
 132
132 -
 133
133 -
 134
134 -
 135
135 -
 136
136 -
 137
137 -
 138
138 -
 139
139 -
 140
140 -
 141
141 -
 142
142 -
 143
143 -
 144
144 -
 145
145 -
 146
146 -
 147
147 -
 148
148 -
 149
149 -
 150
150 -
151
-
152
-
153
-
154
-
155
-
156
-
157
-
158
-
159
-
160
-
161
-
162
-
163
-
164
-
165
-
166
-
167
-
168
-
169
-
170
-
171
-
172
-
173
-
174
-
175
-
176
-
177
-
178
-
179
-
180
-
181
-
182
-
183
-
184
-
185
-
186
-
187
-
188
-
189
-
190
-
191
-
192
-
193
-
194
-
195
-
196
-
197
-
198
-
199
-
200
-
201
-
202
-
203
-
204
-
205
-
206
-
207
-
208
-
209
-
210
-
211
-
212
-
213
-
214
-
215
-
216
-
217
-
218
-
219
-
220
-
221
-
222
-
223
-
224
-
225
-
226
-
227
-
228
-
229
-
230
-
231
-
232
-
233
-
234
-
235
-
236
-
237
-
238
-
239
-
240
-
241
-
242
-
243
-
244
-
245
-
246
-
247
-
248
-
249
-
250
-
251
-
252
-
253
-
254
-
255
-
256
-
257
-
258
-
259
-
260
-
261
-
262
-
263
-
264
-
265
-
266
-
267
-
268
-
269
-
270
-
271
-
272
 |
 |

134 www.allstate.com
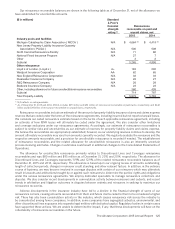
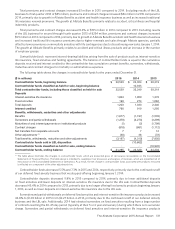
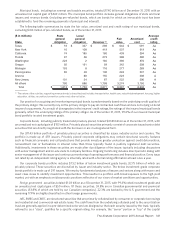
The investment spread by product group for the years ended December 31 is shown in the following table.
($ in millions) 2015 2014 2013
Life insurance $ 130 $ 93 $ 93
Accident and health insurance 5 8 14
Net investment income on investments supporting capital 76 110 113
Subtotal — Allstate Life 211 211 220
Life insurance 10 10 12
Accident and health insurance 11 11 11
Net investment income on investments supporting capital 14 15 14
Subtotal — Allstate Benefits 35 36 37
Annuities and institutional products 238 320 342
Net investment income on investments supporting capital 130 146 158
Subtotal — Allstate Annuities 368 466 500
Investment spread before valuation changes on embedded derivatives that
are not hedged 614 713 757
Valuation changes on derivatives embedded in equity‑indexed annuity
contracts that are not hedged (2) (22) (24)
Total investment spread $ 612 $ 691 $ 733
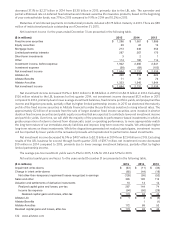
Investment spread before valuation changes on embedded derivatives that are not hedged decreased 13.9% or $99
million in 2015 compared to 2014. Excluding results of the LBL business for first quarter 2014 of $46 million, investment
spread before valuation changes on embedded derivatives that are not hedged decreased $53 million in 2015 compared
to 2014, primarily due to lower net investment income, partially offset by lower credited interest. Investment spread
before valuation changes on embedded derivatives that are not hedged decreased 5.8% or $44 million in 2014 compared
to 2013. Excluding results of the LBL business for the second through fourth quarter of 2013 of $149 million, investment
spread before valuation changes on embedded derivatives that are not hedged increased $105 million in 2014 compared
to 2013, primarily due to higher limited partnership income, higher fixed income yields and lower crediting rates, partially
offset by the continued managed reduction in our spread-based business in force.
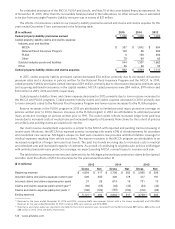
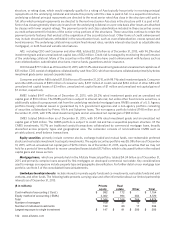
To further analyze investment spreads, the following table summarizes the weighted average investment yield on
assets supporting product liabilities and capital, interest crediting rates and investment spreads. For purposes of these
calculations, investments, reserves and contractholder funds classified as held for sale were included for periods prior
to April 1, 2014. Investment spreads may vary significantly between periods due to the variability in investment income,
particularly for immediate fixed annuities where the investment portfolio includes limited partnerships.
Weighted average
investment yield
Weighted average
interest crediting rate
Weighted average
investment spreads
2015 2014 2013 2015 2014 2013 2015 2014 2013
Interest‑sensitive life insurance 5.2% 5.3% 5.1% 3.9% 3.9% 3.8% 1.3% 1.4% 1.3%
Deferred fixed annuities and
institutional products 4.3 4.5 4.5 2.8 2.9 2.9 1.5 1.6 1.6
Immediate fixed annuities with and
without life contingencies 7.0 7.3 6.9 5.9 6.0 6.0 1.1 1.3 0.9
Investments supporting capital,
traditional life and other products 4.0 4.4 4.0 n/a n/a n/a n/a n/a n/a
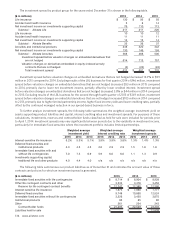
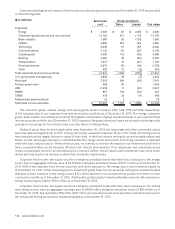
The following table summarizes our product liabilities as of December 31 and indicates the account value of those
contracts and policies for which an investment spread is generated.
($ in millions) 2015 2014 2013
Immediate fixed annuities with life contingencies $ 8,714 $ 8,904 $ 8,928
Other life contingent contracts and other 3,533 3,476 3,458
Reserve for life‑contingent contract benefits $ 12,247 $ 12,380 $ 12,386
Interest‑sensitive life insurance $ 7,975 $ 7,880 $ 7,777
Deferred fixed annuities 9,748 10,860 12,524
Immediate fixed annuities without life contingencies 3,226 3,450 3,675
Institutional products 85 85 85
Other 261 254 243
Contractholder funds $ 21,295 $ 22,529 $ 24,304
Liabilities held for sale $ — $ — $ 12,839