Allstate 2015 Annual Report Download - page 145
Download and view the complete annual report
Please find page 145 of the 2015 Allstate annual report below. You can navigate through the pages in the report by either clicking on the pages listed below, or by using the keyword search tool below to find specific information within the annual report.-
 1
1 -
2
-
3
-
4
-
5
-
6
-
7
-
8
-
9
-
10
-
11
-
12
-
13
-
14
-
15
-
16
-
17
-
18
-
19
-
20
-
21
-
22
-
23
-
24
-
25
-
26
-
27
-
28
-
29
-
30
-
31
-
32
-
33
-
34
-
35
-
36
-
37
-
38
-
39
-
40
-
41
-
42
-
43
-
44
-
45
-
46
-
47
-
48
-
49
-
50
-
51
-
52
-
53
-
54
-
55
-
56
-
57
-
58
-
59
-
60
-
61
-
62
-
63
-
64
-
65
-
66
-
67
-
68
-
69
-
70
-
71
-
72
-
73
-
74
-
75
-
76
-
77
-
78
-
79
-
80
-
81
-
82
-
83
-
84
-
85
-
86
-
87
-
88
-
89
-
90
-
91
-
92
-
93
-
94
-
95
-
96
-
97
-
98
-
99
-
100
-
101
-
102
-
103
-
104
-
105
-
106
-
107
-
108
-
109
-
110
-
111
-
112
-
113
-
114
-
115
-
116
-
117
-
118
-
119
-
120
-
121
-
122
-
123
-
124
-
125
-
126
-
127
-
128
-
129
-
130
-
131
-
132
-
133
-
134
-
 135
135 -
 136
136 -
 137
137 -
 138
138 -
 139
139 -
 140
140 -
 141
141 -
 142
142 -
 143
143 -
 144
144 -
 145
145 -
 146
146 -
 147
147 -
 148
148 -
 149
149 -
 150
150 -
 151
151 -
 152
152 -
 153
153 -
 154
154 -
 155
155 -
156
-
157
-
158
-
159
-
160
-
161
-
162
-
163
-
164
-
165
-
166
-
167
-
168
-
169
-
170
-
171
-
172
-
173
-
174
-
175
-
176
-
177
-
178
-
179
-
180
-
181
-
182
-
183
-
184
-
185
-
186
-
187
-
188
-
189
-
190
-
191
-
192
-
193
-
194
-
195
-
196
-
197
-
198
-
199
-
200
-
201
-
202
-
203
-
204
-
205
-
206
-
207
-
208
-
209
-
210
-
211
-
212
-
213
-
214
-
215
-
216
-
217
-
218
-
219
-
220
-
221
-
222
-
223
-
224
-
225
-
226
-
227
-
228
-
229
-
230
-
231
-
232
-
233
-
234
-
235
-
236
-
237
-
238
-
239
-
240
-
241
-
242
-
243
-
244
-
245
-
246
-
247
-
248
-
249
-
250
-
251
-
252
-
253
-
254
-
255
-
256
-
257
-
258
-
259
-
260
-
261
-
262
-
263
-
264
-
265
-
266
-
267
-
268
-
269
-
270
-
271
-
272
 |
 |

The Allstate Corporation 2015 Annual Report 139
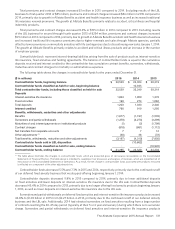
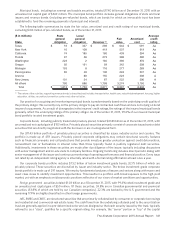
Portfolio composition by reporting segment The composition of the investment portfolios by reporting segment as of
December 31, 2015 is presented in the following table.
($ in millions)
Property-
Liability (5)
Allstate
Financial (5)
Corporate and
Other (5) Total
Percent
to total
Percent
to total
Percent
to total
Percent
to total
Fixed income securities (1) $ 29,732 77.3% $ 26,038 70.8% $ 2,178 87.6% $ 57,948 74.5%
Equity securities (2) 3,480 9.0 1,599 4.4 3 0.1 5,082 6.5
Mortgage loans 296 0.8 4,042 11.0 — — 4,338 5.6
Limited partnership
interests (3) 2,575 6.7 2,295 6.2 4 0.2 4,874 6.3
Short‑term
investments (4) 959 2.5 861 2.3 302 12.1 2,122 2.7
Other 1,437 3.7 1,957 5.3 — — 3,394 4.4
Total $ 38,479 100.0% $ 36,792 100.0% $ 2,487 100.0% $ 77,758 100.0%
(1) Fixed income securities are carried at fair value. Amortized cost basis for these securities was $29.89 billion, $25.15 billion, $2.16 billion and $57.20
billion for Property-Liability, Allstate Financial, Corporate and Other, and in Total, respectively.
(2) Equity securities are carried at fair value. Cost basis for these securities was $3.24 billion, $1.57 billion, $3 million and $4.81 billion for Property-
Liability, Allstate Financial, Corporate and Other, and in Total, respectively.
(3) We have commitments to invest in additional limited partnership interests totaling $1.28 billion, $1.27 billion and $2.55 billion for Property-Liability,
Allstate Financial and in Total, respectively.
(4) Short-term investments are carried at fair value. Amortized cost basis for these investments was $959 million, $861 million, $302 million and $2.12
billion for Property-Liability, Allstate Financial, Corporate and Other, and in Total, respectively.
(5) Balances reflect the elimination of related party investments between segments.
Investments totaled $77.76 billion as of December 31, 2015, decreasing from $81.11 billion as of December 31, 2014,
primarily due to common share repurchases, a decline in fixed income valuations resulting from widening credit spreads
and an increase in risk-free interest rates, net reductions in contractholder funds, dividends paid to shareholders and a
decline in equity valuations.
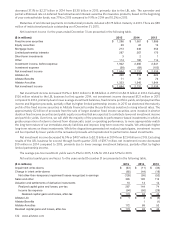
The Property-Liability investment portfolio totaled $38.48 billion as of December 31, 2015, decreasing from $39.08
billion as of December 31, 2014, primarily due to dividends paid by Allstate Insurance Company (“AIC”) to The Allstate
Corporation (the “Corporation”) and a decline in fixed income and equity valuations, partially offset by positive operating
cash flows.
The Allstate Financial investment portfolio totaled $36.79 billion as of December 31, 2015, decreasing from $38.81
billion as of December 31, 2014, primarily due to a decline in fixed income valuations, net reductions in contractholder
funds and dividends paid by ALIC to AIC.
The Corporate and Other investment portfolio totaled $2.49 billion as of December 31, 2015, decreasing from $3.22
billion as of December 31, 2014, primarily due to common share repurchases and dividends paid to shareholders, partially
offset by dividends paid by AIC to the Corporation.
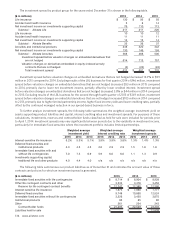
Portfolio composition by investment strategy The following table presents the investment portfolio by strategy as of
December 31, 2015.
($ in millions)
Total
Market-
Based Core
Market-Based
Active
Performance-
Based
Long-Term
Performance-
Based
Opportunistic
Fixed income securities $ 57,948 $ 51,175 $ 6,691 $ 47 $ 35
Equity securities 5,082 4,210 764 77 31
Mortgage loans 4,338 4,338 — — —
Limited partnership interests 4,874 364 — 4,510 —
Short‑term investments 2,122 1,631 491 — —
Other 3,394 2,783 183 415 13
Total $ 77,758 $ 64,501 $ 8,129 $ 5,049 $ 79
% of total 83% 10% 7% —
Property‑Liability $ 38,479 $ 28,525 $ 7,137 $ 2,764 $ 53
% of Property‑Liability 74% 19% 7% —%
Allstate Financial $ 36,792 $ 33,490 $ 992 $ 2,284 $ 26
% of Allstate Financial 91% 3% 6% —%
Corporate & Other $ 2,487 $ 2,486 $ — $ 1 $ —
% of Corporate & Other 100% —% —% —%