Allstate 2015 Annual Report Download - page 39
Download and view the complete annual report
Please find page 39 of the 2015 Allstate annual report below. You can navigate through the pages in the report by either clicking on the pages listed below, or by using the keyword search tool below to find specific information within the annual report.-
 1
1 -
2
-
3
-
4
-
5
-
6
-
7
-
8
-
9
-
10
-
11
-
12
-
13
-
14
-
15
-
16
-
17
-
18
-
19
-
20
-
21
-
22
-
23
-
24
-
25
-
26
-
27
-
28
-
 29
29 -
 30
30 -
 31
31 -
 32
32 -
 33
33 -
 34
34 -
 35
35 -
 36
36 -
 37
37 -
 38
38 -
 39
39 -
 40
40 -
 41
41 -
 42
42 -
 43
43 -
 44
44 -
 45
45 -
 46
46 -
 47
47 -
 48
48 -
 49
49 -
50
-
51
-
52
-
53
-
54
-
55
-
56
-
57
-
58
-
59
-
60
-
61
-
62
-
63
-
64
-
65
-
66
-
67
-
68
-
69
-
70
-
71
-
72
-
73
-
74
-
75
-
76
-
77
-
78
-
79
-
80
-
81
-
82
-
83
-
84
-
85
-
86
-
87
-
88
-
89
-
90
-
91
-
92
-
93
-
94
-
95
-
96
-
97
-
98
-
99
-
100
-
101
-
102
-
103
-
104
-
105
-
106
-
107
-
108
-
109
-
110
-
111
-
112
-
113
-
114
-
115
-
116
-
117
-
118
-
119
-
120
-
121
-
122
-
123
-
124
-
125
-
126
-
127
-
128
-
129
-
130
-
131
-
132
-
133
-
134
-
135
-
136
-
137
-
138
-
139
-
140
-
141
-
142
-
143
-
144
-
145
-
146
-
147
-
148
-
149
-
150
-
151
-
152
-
153
-
154
-
155
-
156
-
157
-
158
-
159
-
160
-
161
-
162
-
163
-
164
-
165
-
166
-
167
-
168
-
169
-
170
-
171
-
172
-
173
-
174
-
175
-
176
-
177
-
178
-
179
-
180
-
181
-
182
-
183
-
184
-
185
-
186
-
187
-
188
-
189
-
190
-
191
-
192
-
193
-
194
-
195
-
196
-
197
-
198
-
199
-
200
-
201
-
202
-
203
-
204
-
205
-
206
-
207
-
208
-
209
-
210
-
211
-
212
-
213
-
214
-
215
-
216
-
217
-
218
-
219
-
220
-
221
-
222
-
223
-
224
-
225
-
226
-
227
-
228
-
229
-
230
-
231
-
232
-
233
-
234
-
235
-
236
-
237
-
238
-
239
-
240
-
241
-
242
-
243
-
244
-
245
-
246
-
247
-
248
-
249
-
250
-
251
-
252
-
253
-
254
-
255
-
256
-
257
-
258
-
259
-
260
-
261
-
262
-
263
-
264
-
265
-
266
-
267
-
268
-
269
-
270
-
271
-
272
 |
 |

The Allstate Corporation 2016 Proxy Statement 33
EXECUTIVE COMPENSATION
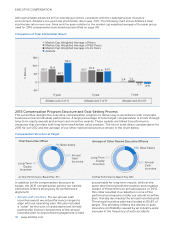
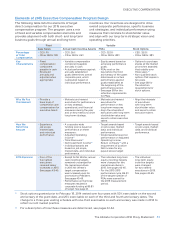
Elements of 2015 Executive Compensation Program Design
The following table lists the elements of target
direct compensation for our 2015 executive
compensation program. The program uses a mix
of fixed and variable compensation elements and
provides alignment with both short- and long-term
business goals through annual and long-term
incentives. Our incentives are designed to drive
overall corporate performance, specific business
unit strategies, and individual performance using
measures that correlate to stockholder value
and align with our long-term strategic vision and
operating priorities.
Fixed Variable
Base Salary Annual Cash Incentive Awards PSAs Stock Options
Percentage
of Total
Compensation
• CEO: 9%
• Other NEOs: 18%
• CEO: 26%
• Other NEOs: 26%
• CEO: 32.5%
• Other NEOs: 28%
• CEO: 32.5%
• Other NEOs: 28%
Key
Characteristics • Fixed
compensation
component
payable in cash.
• Reviewed
annually and
adjusted when
appropriate.
• Variable compensation
component payable
annually in cash.
• Actual performance against
annually established
goals determines overall
corporate pool, which
is allocated based on
individual performance.
• Equity award based on
achieving performance
goals.
• PSAs vest on the
day before the third
anniversary of the grant
date based on actual
performance against
goals established at
the beginning of the
performance period.
• Seepage38 for the
retention requirements
for PSAs.
• Options to purchase
shares at the market
price when awarded.
Vest ratably over
three years.(1)
• Non-qualified stock
options that expire in
ten years.
• Seepage38 for
the retention
requirements for
stock options.
Why We Pay
This Element • Provide a
base level of
competitive cash
compensation for
executive talent.
• Motivate and reward
executives for performance
on key strategic,
operational, and financial
measures during the year
and on key metrics to drive
long-term strategy.
• Motivate and reward
executives for
performance on key
long-term measures.
• Align the interests of
executives with long-term
stockholder value and
serve to retain executive
talent.
• Align the interests
of executives
with long-term
stockholder value
and serve to retain
executive talent.
How We
Determine
Amount
• Experience,
job scope,
market data,
and individual
performance.
• A corporate-wide
funding pool is based on
performance on three
measures:
• Adjusted Operating
Income(2)
• Total Premiums(2)
• Net Investment Income(2)
• Individual awards are
based on job scope,
market data, and individual
performance.
• Target awards based
on job scope, market
data, and individual
performance.
• Vested awards based on
performance on Adjusted
Operating Income
Return on Equity(2) with a
requirement of positive
Net Income for any
payout above target.
• Target awards based
on job scope, market
data, and individual
performance.
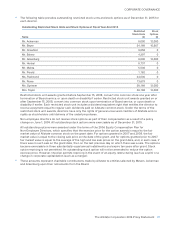
2015Decisions • Four of the
five named
executives
received salary
increases in 2015.
Seepages43-45.
• Except for Mr. Winter, annual
cash incentive targets
remained unchanged for
the named executives
in 2015. Mr. Winter’s
target compensation
was increased upon his
promotion to President.
Seepages43-45.
• Performance on the three
measures resulted in
corporate funding at 80.8%
of target. Seepage41.
• The individual long-term
equity incentive targets
were changed for two
named executives in
2015. Seepages43-45.
• For the 2013-2015
performance cycle, 84.3%
of the target number of
PSAs were earned for
the 2015 measurement
period.
• The individual
long-term equity
incentive targets
were changed
for two named
executives in 2015.
Seepages43-45.
(1) Stock options granted prior to February 18, 2014 vested over four years with 50% exercisable on the second
anniversary of the grant date, and 25% exercisable on each of the third and fourth anniversary dates. The
change to a three-year vesting schedule with one-third exercisable on each anniversary was made in 2014 to
reflect current market practice.
(2) For a description of how these measures are determined, seepages 61-64.