Allstate 2015 Annual Report Download - page 250
Download and view the complete annual report
Please find page 250 of the 2015 Allstate annual report below. You can navigate through the pages in the report by either clicking on the pages listed below, or by using the keyword search tool below to find specific information within the annual report.-
 1
1 -
2
-
3
-
4
-
5
-
6
-
7
-
8
-
9
-
10
-
11
-
12
-
13
-
14
-
15
-
16
-
17
-
18
-
19
-
20
-
21
-
22
-
23
-
24
-
25
-
26
-
27
-
28
-
29
-
30
-
31
-
32
-
33
-
34
-
35
-
36
-
37
-
38
-
39
-
40
-
41
-
42
-
43
-
44
-
45
-
46
-
47
-
48
-
49
-
50
-
51
-
52
-
53
-
54
-
55
-
56
-
57
-
58
-
59
-
60
-
61
-
62
-
63
-
64
-
65
-
66
-
67
-
68
-
69
-
70
-
71
-
72
-
73
-
74
-
75
-
76
-
77
-
78
-
79
-
80
-
81
-
82
-
83
-
84
-
85
-
86
-
87
-
88
-
89
-
90
-
91
-
92
-
93
-
94
-
95
-
96
-
97
-
98
-
99
-
100
-
101
-
102
-
103
-
104
-
105
-
106
-
107
-
108
-
109
-
110
-
111
-
112
-
113
-
114
-
115
-
116
-
117
-
118
-
119
-
120
-
121
-
122
-
123
-
124
-
125
-
126
-
127
-
128
-
129
-
130
-
131
-
132
-
133
-
134
-
135
-
136
-
137
-
138
-
139
-
140
-
141
-
142
-
143
-
144
-
145
-
146
-
147
-
148
-
149
-
150
-
151
-
152
-
153
-
154
-
155
-
156
-
157
-
158
-
159
-
160
-
161
-
162
-
163
-
164
-
165
-
166
-
167
-
168
-
169
-
170
-
171
-
172
-
173
-
174
-
175
-
176
-
177
-
178
-
179
-
180
-
181
-
182
-
183
-
184
-
185
-
186
-
187
-
188
-
189
-
190
-
191
-
192
-
193
-
194
-
195
-
196
-
197
-
198
-
199
-
200
-
201
-
202
-
203
-
204
-
205
-
206
-
207
-
208
-
209
-
210
-
211
-
212
-
213
-
214
-
215
-
216
-
217
-
218
-
219
-
220
-
221
-
222
-
223
-
224
-
225
-
226
-
227
-
228
-
229
-
230
-
231
-
232
-
233
-
234
-
235
-
236
-
237
-
238
-
239
-
 240
240 -
 241
241 -
 242
242 -
 243
243 -
 244
244 -
 245
245 -
 246
246 -
 247
247 -
 248
248 -
 249
249 -
 250
250 -
 251
251 -
 252
252 -
 253
253 -
 254
254 -
 255
255 -
 256
256 -
 257
257 -
 258
258 -
 259
259 -
 260
260 -
261
-
262
-
263
-
264
-
265
-
266
-
267
-
268
-
269
-
270
-
271
-
272
 |
 |

244 www.allstate.com
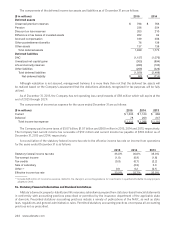
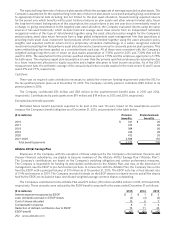
The components of the deferred income tax assets and liabilities as of December 31 are as follows:
($ in millions) 2015 2014
Deferred assets
Unearned premium reserves $ 796 $ 763
Pension 236 254
Discount on loss reserves 203 210
Difference in tax bases of invested assets 202 64
Accrued compensation 189 206
Other postretirement benefits 76 138
Other assets 137 138
Total deferred assets 1,839 1,773
Deferred liabilities
DAC (1,157) (1,076)
Unrealized net capital gains (303) (994)
Life and annuity reserves (260) (192)
Other liabilities (209) (226)
Total deferred liabilities (1,929) (2,488)
Net deferred liability $ (90) $ (715)
Although realization is not assured, management believes it is more likely than not that the deferred tax assets will
be realized based on the Company’s assessment that the deductions ultimately recognized for tax purposes will be fully
utilized.
As of December 31, 2015, the Company has net operating loss carryforwards of $58 million which will expire at the
end of 2025 through 2029.
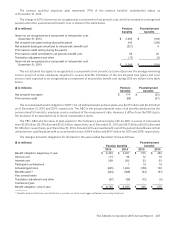
The components of income tax expense for the years ended December 31 are as follows:
($ in millions) 2015 2014 2013
Current $ 1,033 $1,123 $ 869
Deferred 78 263 247
Total income tax expense $ 1,111 $1,386 $ 1,116
The Company paid income taxes of $1.07 billion, $1.07 billion and $500 million in 2015, 2014 and 2013, respectively.
The Company had current income tax receivable of $59 million and current income tax payable of $158 million as of
December 31, 2015 and 2014, respectively.
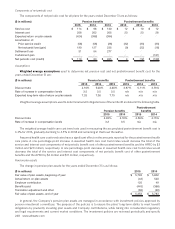
A reconciliation of the statutory federal income tax rate to the effective income tax rate on income from operations
for the years ended December 31 is as follows:
2015 2014 2013
Statutory federal income tax rate 35.0% 35.0% 35.0%
Tax‑exempt income (1.0) (0.9) (1.8)
Tax credits (0.9) (0.7) (2.2)
Sale of subsidiary — (0.9) 2.0
Other (1) 0.8 0.2 (0.1)
Effective income tax rate 33.9% 32.7% 32.9%
(1) Includes $45 million of income tax expense related to the change in accounting guidance for investments in qualified affordable housing projects
adopted in 2015.
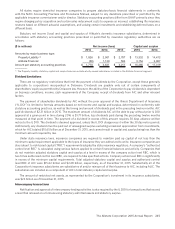
16. Statutory Financial Information and Dividend Limitations
Allstate’s domestic property-liability and life insurance subsidiaries prepare their statutory-basis financial statements
in conformity with accounting practices prescribed or permitted by the insurance department of the applicable state
of domicile. Prescribed statutory accounting practices include a variety of publications of the NAIC, as well as state
laws, regulations and general administrative rules. Permitted statutory accounting practices encompass all accounting
practices not so prescribed.