Allstate 2015 Annual Report Download - page 116
Download and view the complete annual report
Please find page 116 of the 2015 Allstate annual report below. You can navigate through the pages in the report by either clicking on the pages listed below, or by using the keyword search tool below to find specific information within the annual report.-
 1
1 -
2
-
3
-
4
-
5
-
6
-
7
-
8
-
9
-
10
-
11
-
12
-
13
-
14
-
15
-
16
-
17
-
18
-
19
-
20
-
21
-
22
-
23
-
24
-
25
-
26
-
27
-
28
-
29
-
30
-
31
-
32
-
33
-
34
-
35
-
36
-
37
-
38
-
39
-
40
-
41
-
42
-
43
-
44
-
45
-
46
-
47
-
48
-
49
-
50
-
51
-
52
-
53
-
54
-
55
-
56
-
57
-
58
-
59
-
60
-
61
-
62
-
63
-
64
-
65
-
66
-
67
-
68
-
69
-
70
-
71
-
72
-
73
-
74
-
75
-
76
-
77
-
78
-
79
-
80
-
81
-
82
-
83
-
84
-
85
-
86
-
87
-
88
-
89
-
90
-
91
-
92
-
93
-
94
-
95
-
96
-
97
-
98
-
99
-
100
-
101
-
102
-
103
-
104
-
105
-
 106
106 -
 107
107 -
 108
108 -
 109
109 -
 110
110 -
 111
111 -
 112
112 -
 113
113 -
 114
114 -
 115
115 -
 116
116 -
 117
117 -
 118
118 -
 119
119 -
 120
120 -
 121
121 -
 122
122 -
 123
123 -
 124
124 -
 125
125 -
 126
126 -
127
-
128
-
129
-
130
-
131
-
132
-
133
-
134
-
135
-
136
-
137
-
138
-
139
-
140
-
141
-
142
-
143
-
144
-
145
-
146
-
147
-
148
-
149
-
150
-
151
-
152
-
153
-
154
-
155
-
156
-
157
-
158
-
159
-
160
-
161
-
162
-
163
-
164
-
165
-
166
-
167
-
168
-
169
-
170
-
171
-
172
-
173
-
174
-
175
-
176
-
177
-
178
-
179
-
180
-
181
-
182
-
183
-
184
-
185
-
186
-
187
-
188
-
189
-
190
-
191
-
192
-
193
-
194
-
195
-
196
-
197
-
198
-
199
-
200
-
201
-
202
-
203
-
204
-
205
-
206
-
207
-
208
-
209
-
210
-
211
-
212
-
213
-
214
-
215
-
216
-
217
-
218
-
219
-
220
-
221
-
222
-
223
-
224
-
225
-
226
-
227
-
228
-
229
-
230
-
231
-
232
-
233
-
234
-
235
-
236
-
237
-
238
-
239
-
240
-
241
-
242
-
243
-
244
-
245
-
246
-
247
-
248
-
249
-
250
-
251
-
252
-
253
-
254
-
255
-
256
-
257
-
258
-
259
-
260
-
261
-
262
-
263
-
264
-
265
-
266
-
267
-
268
-
269
-
270
-
271
-
272
 |
 |

110 www.allstate.com
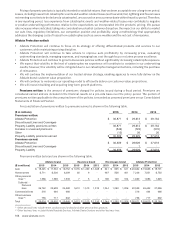
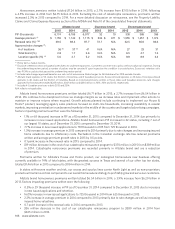
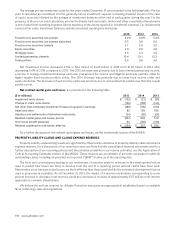
Underwriting results are shown in the following table.
($ in millions) 2015 2014 2013
Premiums written $ 30,871 $ 29,613 $ 28,164
Premiums earned $ 30,309 $ 28,928 $ 27,618
Claims and claims expense (20,981) (19,315) (17,769)
Amortization of DAC (4,102) (3,875) (3,674)
Other costs and expenses (3,573) (3,835) (3,751)
Restructuring and related charges (39) (16) (63)
Underwriting income $ 1,614 $ 1,887 $ 2,361
Catastrophe losses $ 1,719 $ 1,993 $ 1,251
Underwriting income (loss) by line of business
Auto $ 23 $ 604 $ 668
Homeowners 1,431 1,097 1,422
Other personal lines 175 150 198
Commercial lines (40) 9 41
Other business lines 33 40 51
Answer Financial (8) (13) (19)
Underwriting income $ 1,614 $ 1,887 $ 2,361
Underwriting income (loss) by brand
Allstate brand $ 1,812 $ 2,235 $ 2,551
Esurance brand (164) (259) (218)
Encompass brand (26) (76) 47
Answer Financial (8) (13) (19)
Underwriting income $ 1,614 $ 1,887 $ 2,361
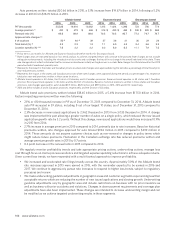
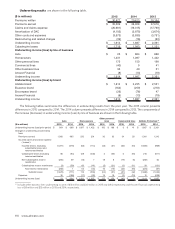
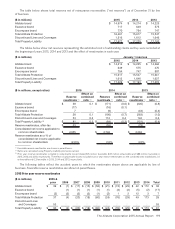
The following tables summarize the differences in underwriting results from the prior year. The 2015 column presents
differences in 2015 compared to 2014. The 2014 column presents differences in 2014 compared to 2013. The components of
the increase (decrease) in underwriting income (loss) by line of business are shown in the following table.
Auto Homeowners
Other personal
lines Commercial lines Allstate Protection (1)
($ in millions) 2015 2014 2015 2014 2015 2014 2015 2014 2015 2014
Underwriting income (loss) prior period $ 604 $ 668 $ 1,097 $ 1,422 $ 150 $ 198 $ 9 $ 41 $ 1,887 $ 2,361
Changes in underwriting income (loss)
from:
Premiums earned 1,066 895 232 291 30 33 34 20 1,381 1,310
Incurred claims and claims expense
(“losses”):
Incurred losses, excluding
catastrophe losses and
reserve reestimates
(1,491) (678) (62) (114) (42) (21) (65) (10) (1,658) (868)
Catastrophe losses excluding
reserve reestimates
80 (94) 128 (446) 2 (55) 6 (16) 216 (611)
Non‑catastrophes reserve
reestimates
(265) 59 (13) 7 18 6 (19) (5) (282) 64
Catastrophes reserve reestimates (3) (58) 66 (41) (2) (21) (3) (11) 58 (131)
Total reserve reestimates (268) 1 53 (34) 16 (15) (22) (16) (224) (67)
Subtotal losses (1,679) (771) 119 (594) (24) (91) (81) (42) (1,666) (1,546)
Expenses 32 (188) (17) (22) 19 10 (2) (10) 12 (238)
Underwriting income (loss) $ 23 $ 604 $ 1,431 $ 1,097 $ 175 $ 150 $ (40) $ 9 $ 1,614 $ 1,887
(1) Includes other business lines underwriting income of $33 million and $40 million in 2015 and 2014, respectively, and Answer Financial underwriting
loss of $8 million and $13 million in 2015 and 2014, respectively.