Allstate 2015 Annual Report Download - page 216
Download and view the complete annual report
Please find page 216 of the 2015 Allstate annual report below. You can navigate through the pages in the report by either clicking on the pages listed below, or by using the keyword search tool below to find specific information within the annual report.-
 1
1 -
2
-
3
-
4
-
5
-
6
-
7
-
8
-
9
-
10
-
11
-
12
-
13
-
14
-
15
-
16
-
17
-
18
-
19
-
20
-
21
-
22
-
23
-
24
-
25
-
26
-
27
-
28
-
29
-
30
-
31
-
32
-
33
-
34
-
35
-
36
-
37
-
38
-
39
-
40
-
41
-
42
-
43
-
44
-
45
-
46
-
47
-
48
-
49
-
50
-
51
-
52
-
53
-
54
-
55
-
56
-
57
-
58
-
59
-
60
-
61
-
62
-
63
-
64
-
65
-
66
-
67
-
68
-
69
-
70
-
71
-
72
-
73
-
74
-
75
-
76
-
77
-
78
-
79
-
80
-
81
-
82
-
83
-
84
-
85
-
86
-
87
-
88
-
89
-
90
-
91
-
92
-
93
-
94
-
95
-
96
-
97
-
98
-
99
-
100
-
101
-
102
-
103
-
104
-
105
-
106
-
107
-
108
-
109
-
110
-
111
-
112
-
113
-
114
-
115
-
116
-
117
-
118
-
119
-
120
-
121
-
122
-
123
-
124
-
125
-
126
-
127
-
128
-
129
-
130
-
131
-
132
-
133
-
134
-
135
-
136
-
137
-
138
-
139
-
140
-
141
-
142
-
143
-
144
-
145
-
146
-
147
-
148
-
149
-
150
-
151
-
152
-
153
-
154
-
155
-
156
-
157
-
158
-
159
-
160
-
161
-
162
-
163
-
164
-
165
-
166
-
167
-
168
-
169
-
170
-
171
-
172
-
173
-
174
-
175
-
176
-
177
-
178
-
179
-
180
-
181
-
182
-
183
-
184
-
185
-
186
-
187
-
188
-
189
-
190
-
191
-
192
-
193
-
194
-
195
-
196
-
197
-
198
-
199
-
200
-
201
-
202
-
203
-
204
-
205
-
 206
206 -
 207
207 -
 208
208 -
 209
209 -
 210
210 -
 211
211 -
 212
212 -
 213
213 -
 214
214 -
 215
215 -
 216
216 -
 217
217 -
 218
218 -
 219
219 -
 220
220 -
 221
221 -
 222
222 -
 223
223 -
 224
224 -
 225
225 -
 226
226 -
227
-
228
-
229
-
230
-
231
-
232
-
233
-
234
-
235
-
236
-
237
-
238
-
239
-
240
-
241
-
242
-
243
-
244
-
245
-
246
-
247
-
248
-
249
-
250
-
251
-
252
-
253
-
254
-
255
-
256
-
257
-
258
-
259
-
260
-
261
-
262
-
263
-
264
-
265
-
266
-
267
-
268
-
269
-
270
-
271
-
272
 |
 |

210 www.allstate.com
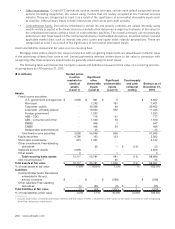
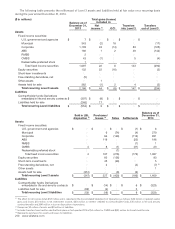
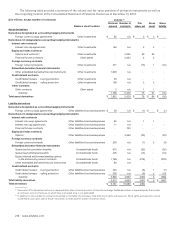
The following table presents the rollforward of Level 3 assets and liabilities held at fair value on a recurring basis
during the year ended December 31, 2014.
($ in millions)
Balance as of
December 31,
2013
Total gains (losses)
included in:
Transfers
into Level 3 Transfers
out of Level 3
Net
income (1) OCI
Assets
Fixed income securities:
U.S. government and agencies $ 7 $ — $ — $ — $ —
Municipal 343 (2) 18 — (17)
Corporate 1,109 24 (14) 89 (125)
ABS 192 1 2 49 (144)
RMBS 2 — — — —
CMBS 43 (1) — 5 (4)
Redeemable preferred stock 1 — — — —
Total fixed income securities 1,697 22 6 143 (290)
Equity securities 132 22 (16) — (2)
Short‑term investments — — — — —
Free‑standing derivatives, net (5) — — — —
Other assets — 1 — — —
Assets held for sale 362 (1) 2 4 (2)
Total recurring Level 3 assets $ 2,186 $ 44 $ (8) $ 147 $ (294)
Liabilities
Contractholder funds: Derivatives
embedded in life and annuity contracts $ (307) $ (8) $ — $ — $ —
Liabilities held for sale (246) 17 — — —
Total recurring Level 3 liabilities $ (553) $ 9 $ — $ — $ —
Sold in LBL
disposition (3) Purchases/
Issues (4) Sales Settlements
Balance as of
December 31,
2014
Assets
Fixed income securities:
U.S. government and agencies $ — $ — $ — $ (1) $ 6
Municipal — 6 (74) (4) 270
Corporate — 64 (140) (116) 891
ABS — 119 — (23) 196
RMBS — — — (1) 1
CMBS 4 8 (1) (31) 23
Redeemable preferred stock — — (1) — —
Total fixed income securities 4 197 (216) (176) 1,387
Equity securities — 83 (136) — 83
Short‑term investments — 45 (40) — 5
Free‑standing derivatives, net — 2 — (4) (7) (2)
Other assets — — — — 1
Assets held for sale (351) — (8) (6) —
Total recurring Level 3 assets $ (347) $ 327 $ (400) $ (186) $ 1,469
Liabilities
Contractholder funds: Derivatives
embedded in life and annuity contracts $ — $ (14) $ — $ 6 $ (323)
Liabilities held for sale 230 (4) — 3 —
Total recurring Level 3 liabilities $ 230 $ (18) $ — $ 9 $ (323)
(1) The effect to net income totals $53 million and is reported in the Consolidated Statements of Operations as follows: $34 million in realized capital
gains and losses, $13 million in net investment income, $(5) million in interest credited to contractholder funds, $15 million in life and annuity
contract benefits and $(4) million in loss on disposition of operations.
(2) Comprises $2 million of assets and $9 million of liabilities.
(3) Includes transfers from held for sale that took place in first quarter 2014 of $4 million for CMBS and $(4) million for Assets held for sale.
(4) Represents purchases for assets and issues for liabilities.