Allstate 2015 Annual Report Download - page 126
Download and view the complete annual report
Please find page 126 of the 2015 Allstate annual report below. You can navigate through the pages in the report by either clicking on the pages listed below, or by using the keyword search tool below to find specific information within the annual report.-
 1
1 -
2
-
3
-
4
-
5
-
6
-
7
-
8
-
9
-
10
-
11
-
12
-
13
-
14
-
15
-
16
-
17
-
18
-
19
-
20
-
21
-
22
-
23
-
24
-
25
-
26
-
27
-
28
-
29
-
30
-
31
-
32
-
33
-
34
-
35
-
36
-
37
-
38
-
39
-
40
-
41
-
42
-
43
-
44
-
45
-
46
-
47
-
48
-
49
-
50
-
51
-
52
-
53
-
54
-
55
-
56
-
57
-
58
-
59
-
60
-
61
-
62
-
63
-
64
-
65
-
66
-
67
-
68
-
69
-
70
-
71
-
72
-
73
-
74
-
75
-
76
-
77
-
78
-
79
-
80
-
81
-
82
-
83
-
84
-
85
-
86
-
87
-
88
-
89
-
90
-
91
-
92
-
93
-
94
-
95
-
96
-
97
-
98
-
99
-
100
-
101
-
102
-
103
-
104
-
105
-
106
-
107
-
108
-
109
-
110
-
111
-
112
-
113
-
114
-
115
-
 116
116 -
 117
117 -
 118
118 -
 119
119 -
 120
120 -
 121
121 -
 122
122 -
 123
123 -
 124
124 -
 125
125 -
 126
126 -
 127
127 -
 128
128 -
 129
129 -
 130
130 -
 131
131 -
 132
132 -
 133
133 -
 134
134 -
 135
135 -
 136
136 -
137
-
138
-
139
-
140
-
141
-
142
-
143
-
144
-
145
-
146
-
147
-
148
-
149
-
150
-
151
-
152
-
153
-
154
-
155
-
156
-
157
-
158
-
159
-
160
-
161
-
162
-
163
-
164
-
165
-
166
-
167
-
168
-
169
-
170
-
171
-
172
-
173
-
174
-
175
-
176
-
177
-
178
-
179
-
180
-
181
-
182
-
183
-
184
-
185
-
186
-
187
-
188
-
189
-
190
-
191
-
192
-
193
-
194
-
195
-
196
-
197
-
198
-
199
-
200
-
201
-
202
-
203
-
204
-
205
-
206
-
207
-
208
-
209
-
210
-
211
-
212
-
213
-
214
-
215
-
216
-
217
-
218
-
219
-
220
-
221
-
222
-
223
-
224
-
225
-
226
-
227
-
228
-
229
-
230
-
231
-
232
-
233
-
234
-
235
-
236
-
237
-
238
-
239
-
240
-
241
-
242
-
243
-
244
-
245
-
246
-
247
-
248
-
249
-
250
-
251
-
252
-
253
-
254
-
255
-
256
-
257
-
258
-
259
-
260
-
261
-
262
-
263
-
264
-
265
-
266
-
267
-
268
-
269
-
270
-
271
-
272
 |
 |

120 www.allstate.com
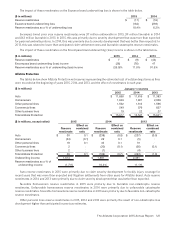
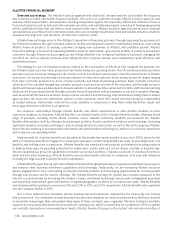
2014 Prior year reserve reestimates
($ in millions) 2004 &
prior 2005 2006 2007 2008 2009 2010 2011 2012 2013 Total
Allstate brand $ (38) $ (10) $ (11) $ 2 $ (20) $ 37 $ (86) $ (35) $ (99) $ 89 $ (171)
Esurance brand — — — — — — — (9) 6 (13) (16)
Encompass brand 2 1 — 1 (1) (2) (2) (5) (6) 3 (9)
Total Allstate Protection (36) (9) (11) 3 (21) 35 (88) (49) (99) 79 (196)
Discontinued Lines and
Coverages 112 — — — — — — — — — 112
Total Property‑Liability $ 76 $ (9) $ (11) $ 3 $ (21) $ 35 $ (88) $ (49) $ (99) $ 79 $ (84)
2013 Prior Year Reserve Reestimates
($ in millions) 2003 &
prior 2004 2005 2006 2007 2008 2009 2010 2011 2012 Total
Allstate brand $ 56 $ 5 $ (33) $ (44) $ (45) $ (32) $ (59) $ (16) $ (70) $ 18 $ (220)
Esurance brand — — — — — — — — — — —
Encompass brand 2 1 1 (1) (1) (5) (4) (4) (14) (18) (43)
Total Allstate Protection 58 6 (32) (45) (46) (37) (63) (20) (84) — (263)
Discontinued Lines and
Coverages 142 — — — — — — — — — 142
Total Property‑Liability $ 200 $ 6 $ (32) $ (45) $ (46) $ (37) $ (63) $ (20) $ (84) $ — $ (121)
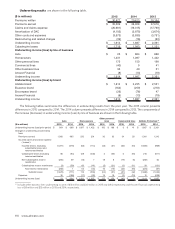
Allstate brand prior year reserve reestimates were $38 million unfavorable in 2015, $171 million favorable in 2014
and $220 million favorable in 2013. In 2015, this was primarily due to severity development for bodily injury coverage for
recent years that was more than expected and litigation settlements from older years. In 2014, this was primarily due to
severity development that was better than expected. In 2013, this was primarily due to severity development that was
better than expected and catastrophe reserve reestimates.
These trends are primarily responsible for revisions to loss development factors, as described above, used to predict
how losses are likely to develop from the end of a reporting period until all claims have been paid. Because these
trends cause actual losses to differ from those predicted by the estimated development factors used in prior reserve
estimates, reserves are revised as actuarial studies validate new trends based on the indications of updated development
factor calculations.
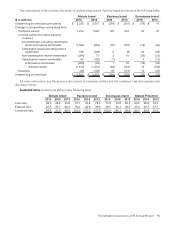
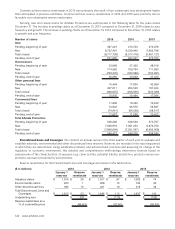
The impact of these reestimates on the Allstate brand underwriting income is shown in the table below.
($ in millions) 2015 2014 2013
Reserve reestimates $ 38 $ (171) $ (220)
Allstate brand underwriting income 1,812 2,235 2,551
Reserve reestimates as a % of underwriting income (2.1)% 7.7% 8.6%
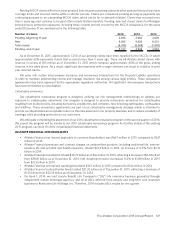
Esurance brand prior year reserve reestimates were $17 million favorable in 2015 and $16 million favorable in 2014.
In 2015 and 2014, this was primarily due to severity development that was better than expected for liability coverages.
There were no prior year reserve reestimates for Esurance in 2013.