Allstate 2015 Annual Report Download - page 149
Download and view the complete annual report
Please find page 149 of the 2015 Allstate annual report below. You can navigate through the pages in the report by either clicking on the pages listed below, or by using the keyword search tool below to find specific information within the annual report.-
 1
1 -
2
-
3
-
4
-
5
-
6
-
7
-
8
-
9
-
10
-
11
-
12
-
13
-
14
-
15
-
16
-
17
-
18
-
19
-
20
-
21
-
22
-
23
-
24
-
25
-
26
-
27
-
28
-
29
-
30
-
31
-
32
-
33
-
34
-
35
-
36
-
37
-
38
-
39
-
40
-
41
-
42
-
43
-
44
-
45
-
46
-
47
-
48
-
49
-
50
-
51
-
52
-
53
-
54
-
55
-
56
-
57
-
58
-
59
-
60
-
61
-
62
-
63
-
64
-
65
-
66
-
67
-
68
-
69
-
70
-
71
-
72
-
73
-
74
-
75
-
76
-
77
-
78
-
79
-
80
-
81
-
82
-
83
-
84
-
85
-
86
-
87
-
88
-
89
-
90
-
91
-
92
-
93
-
94
-
95
-
96
-
97
-
98
-
99
-
100
-
101
-
102
-
103
-
104
-
105
-
106
-
107
-
108
-
109
-
110
-
111
-
112
-
113
-
114
-
115
-
116
-
117
-
118
-
119
-
120
-
121
-
122
-
123
-
124
-
125
-
126
-
127
-
128
-
129
-
130
-
131
-
132
-
133
-
134
-
135
-
136
-
137
-
138
-
 139
139 -
 140
140 -
 141
141 -
 142
142 -
 143
143 -
 144
144 -
 145
145 -
 146
146 -
 147
147 -
 148
148 -
 149
149 -
 150
150 -
 151
151 -
 152
152 -
 153
153 -
 154
154 -
 155
155 -
 156
156 -
 157
157 -
 158
158 -
 159
159 -
160
-
161
-
162
-
163
-
164
-
165
-
166
-
167
-
168
-
169
-
170
-
171
-
172
-
173
-
174
-
175
-
176
-
177
-
178
-
179
-
180
-
181
-
182
-
183
-
184
-
185
-
186
-
187
-
188
-
189
-
190
-
191
-
192
-
193
-
194
-
195
-
196
-
197
-
198
-
199
-
200
-
201
-
202
-
203
-
204
-
205
-
206
-
207
-
208
-
209
-
210
-
211
-
212
-
213
-
214
-
215
-
216
-
217
-
218
-
219
-
220
-
221
-
222
-
223
-
224
-
225
-
226
-
227
-
228
-
229
-
230
-
231
-
232
-
233
-
234
-
235
-
236
-
237
-
238
-
239
-
240
-
241
-
242
-
243
-
244
-
245
-
246
-
247
-
248
-
249
-
250
-
251
-
252
-
253
-
254
-
255
-
256
-
257
-
258
-
259
-
260
-
261
-
262
-
263
-
264
-
265
-
266
-
267
-
268
-
269
-
270
-
271
-
272
 |
 |

The Allstate Corporation 2015 Annual Report 143
Short-term investments totaled $2.12 billion as of December 31, 2015.
Other investments primarily comprise $1.57 billion of bank loans, $905 million of policy loans, $422 million of agent
loans (loans issued to exclusive Allstate agents) and $53 million of derivatives as of December 31, 2015. For further detail
on our use of derivatives, see Note 7 of the consolidated financial statements.
Unrealized net capital gains totaled $1.03 billion as of December 31, 2015 compared to $3.17 billion as of December
31, 2014. The decrease for fixed income securities was primarily due to wider credit spreads, an increase in risk-free interest
rates and the realization of unrealized net capital gains through sales. The decrease for equity securities was primarily due
to negative equity market performance and the realization of unrealized net capital gains through sales, partially offset by
the realization of unrealized net capital losses through write-downs.
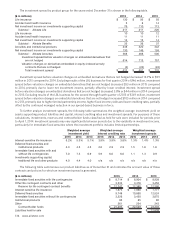
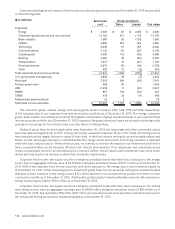
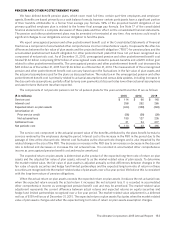
The following table presents unrealized net capital gains and losses as of December 31.
($ in millions) 2015 2014
U.S. government and agencies $ 86 $ 136
Municipal 369 620
Corporate 153 1,758
Foreign government 50 102
ABS (32) 7
RMBS 90 99
CMBS 28 42
Redeemable preferred stock 3 4
Fixed income securities 747 2,768
Equity securities 276 412
Derivatives 6 (2)
EMA limited partnerships (4) (5)
Unrealized net capital gains and losses, pre‑tax $ 1,025 $ 3,173
We have a comprehensive portfolio monitoring process to identify and evaluate each fixed income and equity
security that may be other-than-temporarily impaired. The process includes a quarterly review of all securities to identify
instances where the fair value of a security compared to its amortized cost (for fixed income securities) or cost (for equity
securities) is below established thresholds. The process also includes the monitoring of other impairment indicators such
as ratings, ratings downgrades and payment defaults. The securities identified, in addition to other securities for which
we may have a concern, are evaluated for potential other-than-temporary impairment using all reasonably available
information relevant to the collectability or recovery of the security. Inherent in our evaluation of other-than-temporary
impairment for these fixed income and equity securities are assumptions and estimates about the financial condition
and future earnings potential of the issue or issuer. Some of the factors that may be considered in evaluating whether
a decline in fair value is other than temporary are: 1) the financial condition, near-term and long-term prospects of the
issue or issuer, including relevant industry specific market conditions and trends, geographic location and implications
of rating agency actions and offering prices; 2) the specific reasons that a security is in an unrealized loss position,
including overall market conditions which could affect liquidity; and 3) the length of time and extent to which the fair
value has been less than amortized cost or cost. All investments in an unrealized loss position as of December 31, 2015
were included in our portfolio monitoring process for determining whether declines in value were other than temporary.
The unrealized net capital gain for the fixed income portfolio totaled $747 million, comprised of $1.71 billion of gross
unrealized gains and $960 million of gross unrealized losses as of December 31, 2015. This is compared to an unrealized
net capital gain for the fixed income portfolio totaling $2.77 billion, comprised of $3.08 billion of gross unrealized gains
and $314 million of gross unrealized losses as of December 31, 2014.