Allstate 2015 Annual Report Download - page 163
Download and view the complete annual report
Please find page 163 of the 2015 Allstate annual report below. You can navigate through the pages in the report by either clicking on the pages listed below, or by using the keyword search tool below to find specific information within the annual report.-
 1
1 -
2
-
3
-
4
-
5
-
6
-
7
-
8
-
9
-
10
-
11
-
12
-
13
-
14
-
15
-
16
-
17
-
18
-
19
-
20
-
21
-
22
-
23
-
24
-
25
-
26
-
27
-
28
-
29
-
30
-
31
-
32
-
33
-
34
-
35
-
36
-
37
-
38
-
39
-
40
-
41
-
42
-
43
-
44
-
45
-
46
-
47
-
48
-
49
-
50
-
51
-
52
-
53
-
54
-
55
-
56
-
57
-
58
-
59
-
60
-
61
-
62
-
63
-
64
-
65
-
66
-
67
-
68
-
69
-
70
-
71
-
72
-
73
-
74
-
75
-
76
-
77
-
78
-
79
-
80
-
81
-
82
-
83
-
84
-
85
-
86
-
87
-
88
-
89
-
90
-
91
-
92
-
93
-
94
-
95
-
96
-
97
-
98
-
99
-
100
-
101
-
102
-
103
-
104
-
105
-
106
-
107
-
108
-
109
-
110
-
111
-
112
-
113
-
114
-
115
-
116
-
117
-
118
-
119
-
120
-
121
-
122
-
123
-
124
-
125
-
126
-
127
-
128
-
129
-
130
-
131
-
132
-
133
-
134
-
135
-
136
-
137
-
138
-
139
-
140
-
141
-
142
-
143
-
144
-
145
-
146
-
147
-
148
-
149
-
150
-
151
-
152
-
 153
153 -
 154
154 -
 155
155 -
 156
156 -
 157
157 -
 158
158 -
 159
159 -
 160
160 -
 161
161 -
 162
162 -
 163
163 -
 164
164 -
 165
165 -
 166
166 -
 167
167 -
 168
168 -
 169
169 -
 170
170 -
 171
171 -
 172
172 -
 173
173 -
174
-
175
-
176
-
177
-
178
-
179
-
180
-
181
-
182
-
183
-
184
-
185
-
186
-
187
-
188
-
189
-
190
-
191
-
192
-
193
-
194
-
195
-
196
-
197
-
198
-
199
-
200
-
201
-
202
-
203
-
204
-
205
-
206
-
207
-
208
-
209
-
210
-
211
-
212
-
213
-
214
-
215
-
216
-
217
-
218
-
219
-
220
-
221
-
222
-
223
-
224
-
225
-
226
-
227
-
228
-
229
-
230
-
231
-
232
-
233
-
234
-
235
-
236
-
237
-
238
-
239
-
240
-
241
-
242
-
243
-
244
-
245
-
246
-
247
-
248
-
249
-
250
-
251
-
252
-
253
-
254
-
255
-
256
-
257
-
258
-
259
-
260
-
261
-
262
-
263
-
264
-
265
-
266
-
267
-
268
-
269
-
270
-
271
-
272
 |
 |

The Allstate Corporation 2015 Annual Report 157
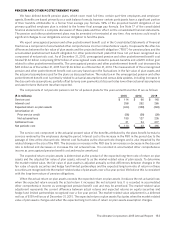
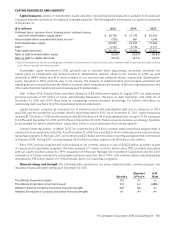
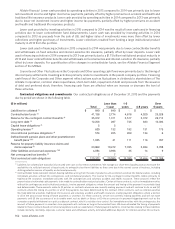
CAPITAL RESOURCES AND LIQUIDITY
Capital resources consist of shareholders’ equity and debt, representing funds deployed or available to be deployed
to support business operations or for general corporate purposes. The following table summarizes our capital resources as
of December 31.
($ in millions) 2015 2014 2013
Preferred stock, common stock, treasury stock, retained income
and other shareholders’ equity items $ 20,780 $ 21,743 $ 20,434
Accumulated other comprehensive (loss) income (755) 561 1,046
Total shareholders’ equity 20,025 22,304 21,480
Debt (1) 5,124 5,140 6,141
Total capital resources $ 25,149 $ 27,444 $ 27,621
Ratio of debt to shareholders’ equity 25.6% 23.0% 28.6%
Ratio of debt to capital resources 20.4% 18.7% 22.2%
(1) Due to the adoption of new accounting guidance related to the presentation of debt issuance costs, long-term debt is reported net of debt issuance
costs. All prior periods have been adjusted.
Shareholders’ equity decreased in 2015, primarily due to common share repurchases, decreased unrealized net
capital gains on investments and dividends paid to shareholders, partially offset by net income. In 2015, we paid
dividends of $483 million and $116 million related to our common and preferred shares, respectively. Shareholders’
equity increased in 2014, primarily due to net income, the issuance of preferred stock and increased unrealized net
capital gains on investments, partially offset by common share repurchases, an increase in the unrecognized pension and
other postretirement benefit cost and dividends paid to shareholders.
Debt In May 2015, Federal Home Loan Bank advances of $8 million were repaid. In August 2015, we repurchased
principal amounts of $11 million of Junior Subordinated Debentures. We have no debt maturities until 2018. As of
December 31, 2015 and 2014, there were no outstanding commercial paper borrowings. For further information on
outstanding debt, see Note 12 of the consolidated financial statements.
Capital resources comprise an increased mix of preferred stock and subordinated debt due to issuances in 2013
and 2014 and the completion of a tender offer to repurchase debt in 2013. As of December 31, 2015, capital resources
includes $1.75 billion or 7.0% of preferred stock and $2.04 billion or 8.1% of subordinated debt, a total of 15.1% compared
to 13.8% as of December 31, 2014 and 10.2% as of December 31, 2013. These resources increase our strategic flexibility
by decreasing our debt to shareholders’ equity ratio, which is one determinant of borrowing capacity.
Common share repurchases In March 2015, we commenced a $3 billion common share repurchase program that is
expected to be completed by July 2016. As of December 31, 2015, there was $532 million remaining on the common share
repurchase program. In February 2015, we completed a $2.5 billion common share repurchase program that commenced
in February 2014. During 2015, we repurchased 42.8 million common shares for $2.80 billion in the market.
Since 1995, we have acquired 645 million shares of our common stock at a cost of $28.23 billion, primarily as part
of various stock repurchase programs. We have reissued 127 million common shares since 1995, primarily associated
with our equity incentive plans, the 1999 acquisition of American Heritage Life Investment Corporation and the 2001
redemption of certain mandatorily redeemable preferred securities. Since 1995, total common shares outstanding has
decreased by 518 million shares or 57.6%, primarily due to our repurchase programs.
Financial ratings and strength The following table summarizes our senior long-term debt, commercial paper and
insurance financial strength ratings as of December 31, 2015.
Moody’s
Standard
& Poor’s
A.M.
Best
The Allstate Corporation (debt) A3 A‑ a‑
The Allstate Corporation (short‑term issuer) P‑2 A‑1 AMB‑1
Allstate Insurance Company (insurance financial strength) Aa3 AA‑ A+
Allstate Life Insurance Company (insurance financial strength) A1 A+ A+