Allstate 2015 Annual Report Download - page 161
Download and view the complete annual report
Please find page 161 of the 2015 Allstate annual report below. You can navigate through the pages in the report by either clicking on the pages listed below, or by using the keyword search tool below to find specific information within the annual report.-
 1
1 -
2
-
3
-
4
-
5
-
6
-
7
-
8
-
9
-
10
-
11
-
12
-
13
-
14
-
15
-
16
-
17
-
18
-
19
-
20
-
21
-
22
-
23
-
24
-
25
-
26
-
27
-
28
-
29
-
30
-
31
-
32
-
33
-
34
-
35
-
36
-
37
-
38
-
39
-
40
-
41
-
42
-
43
-
44
-
45
-
46
-
47
-
48
-
49
-
50
-
51
-
52
-
53
-
54
-
55
-
56
-
57
-
58
-
59
-
60
-
61
-
62
-
63
-
64
-
65
-
66
-
67
-
68
-
69
-
70
-
71
-
72
-
73
-
74
-
75
-
76
-
77
-
78
-
79
-
80
-
81
-
82
-
83
-
84
-
85
-
86
-
87
-
88
-
89
-
90
-
91
-
92
-
93
-
94
-
95
-
96
-
97
-
98
-
99
-
100
-
101
-
102
-
103
-
104
-
105
-
106
-
107
-
108
-
109
-
110
-
111
-
112
-
113
-
114
-
115
-
116
-
117
-
118
-
119
-
120
-
121
-
122
-
123
-
124
-
125
-
126
-
127
-
128
-
129
-
130
-
131
-
132
-
133
-
134
-
135
-
136
-
137
-
138
-
139
-
140
-
141
-
142
-
143
-
144
-
145
-
146
-
147
-
148
-
149
-
150
-
 151
151 -
 152
152 -
 153
153 -
 154
154 -
 155
155 -
 156
156 -
 157
157 -
 158
158 -
 159
159 -
 160
160 -
 161
161 -
 162
162 -
 163
163 -
 164
164 -
 165
165 -
 166
166 -
 167
167 -
 168
168 -
 169
169 -
 170
170 -
 171
171 -
172
-
173
-
174
-
175
-
176
-
177
-
178
-
179
-
180
-
181
-
182
-
183
-
184
-
185
-
186
-
187
-
188
-
189
-
190
-
191
-
192
-
193
-
194
-
195
-
196
-
197
-
198
-
199
-
200
-
201
-
202
-
203
-
204
-
205
-
206
-
207
-
208
-
209
-
210
-
211
-
212
-
213
-
214
-
215
-
216
-
217
-
218
-
219
-
220
-
221
-
222
-
223
-
224
-
225
-
226
-
227
-
228
-
229
-
230
-
231
-
232
-
233
-
234
-
235
-
236
-
237
-
238
-
239
-
240
-
241
-
242
-
243
-
244
-
245
-
246
-
247
-
248
-
249
-
250
-
251
-
252
-
253
-
254
-
255
-
256
-
257
-
258
-
259
-
260
-
261
-
262
-
263
-
264
-
265
-
266
-
267
-
268
-
269
-
270
-
271
-
272
 |
 |
The Allstate Corporation 2015 Annual Report 155
Significant changes in discount rates, such as those caused by changes in the credit spreads, yield curve, the mix of bonds
available in the market, the duration of selected bonds and expected benefit payments, may result in volatility in pension
cost and accumulated other comprehensive income.
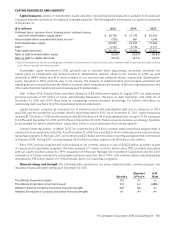
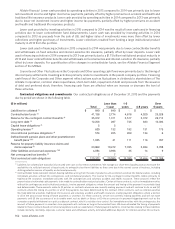
Holding other assumptions constant, a hypothetical decrease of 100 basis points in the discount rate would result in
an increase of $33 million, pre-tax, in net periodic pension cost and a $426 million after-tax, increase in the unrecognized
pension cost liability recorded as accumulated other comprehensive income as of December 31, 2015, compared to an
increase of $31 million, pre-tax, in net periodic pension cost and a $444 million, after-tax, increase in the unrecognized
pension cost liability as of December 31, 2014. A hypothetical increase of 100 basis points in the discount rate would
decrease net periodic pension cost by $30 million, pre-tax, and would decrease the unrecognized pension cost liability
recorded as accumulated other comprehensive income by $360 million, after-tax, as of December 31, 2015, compared to
a decrease in net periodic pension cost of $29 million, pre-tax, and a $377 million, after-tax, decrease in the unrecognized
pension cost liability recorded as accumulated other comprehensive income as of December 31, 2014. This non-
symmetrical range results from the non-linear relationship between discount rates and pension obligations, and changes
in the amortization of unrealized net actuarial gains and losses.
The expected long-term rate of return on plan assets reflects the average rate of earnings expected on plan assets.
While this rate reflects long-term assumptions and is consistent with long-term historical returns, sustained changes
in the market or changes in the mix of plan assets may lead to revisions in the assumed long-term rate of return on
plan assets that may result in variability of pension cost. Differences between the actual return on plan assets and the
expected long-term rate of return on plan assets are a component of net actuarial loss and are recorded in accumulated
other comprehensive income.
Holding other assumptions constant, a hypothetical decrease of 100 basis points in the expected long-term rate of
return on plan assets would result in an increase of $54 million in pension cost as of December 31, 2015, compared to
$57 million as of December 31, 2014. A hypothetical increase of 100 basis points in the expected long-term rate of return
on plan assets would result in a decrease in net periodic pension cost of $54 million as of December 31, 2015, compared
to $57 million as of December 31, 2014.
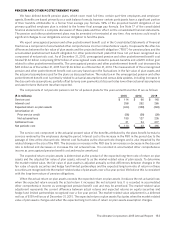
The primary qualified plans have unrealized net gains as of December 31, 2015 of $219 million, a decrease of $291
million from the prior year. $283 million of unrealized gains are related to equity securities as of December 31, 2015
compared to $413 million as of December 31, 2014. During 2015, the two primary qualified plans realized capital gains
of $138 million. Given the Plan’s exposure to an increase in interest rates, the plans continue to maintain a shortened
duration in the fixed income portfolio.
We target funding levels in accordance with regulations under the Internal Revenue Code (“IRC”) and generally
accepted actuarial principles. Our funding levels were within our targeted range as of December 31, 2015. In 2015, we
contributed $125 million to our pension plans. We expect to contribute $129 million for the 2016 fiscal year to maintain
the plans’ funded status. This estimate could change significantly following either an improvement or decline in
investment markets.
Participating subsidiaries fund the Plans’ contributions under our master services cost sharing agreement. In addition,
as a result of joint and several pension liability rules under the IRC and the Employee Retirement Income Security Act of
1974, as amended, many liabilities that arise in connection with pension plans are joint and several across all members
of a controlled group of entities.
GOODWILL
Goodwill represents the excess of amounts paid for acquiring businesses over the fair value of the net assets acquired.
The goodwill balances were $823 million and $396 million as of December 31, 2015 for the Allstate Protection segment
and the Allstate Financial segment, respectively. Our reporting units are equivalent to our reporting segments, Allstate
Protection and Allstate Financial. Goodwill is allocated to reporting units based on which unit is expected to benefit from
the synergies of the business combination.
Goodwill is not amortized but is tested for impairment at least annually. We perform our annual goodwill impairment
testing during the fourth quarter of each year based upon data as of the close of the third quarter. We also review goodwill
for impairment whenever events or changes in circumstances, such as deteriorating or adverse market conditions,
indicate that it is more likely than not that the carrying amount of goodwill may exceed its implied fair value.