Allstate 2015 Annual Report Download - page 206
Download and view the complete annual report
Please find page 206 of the 2015 Allstate annual report below. You can navigate through the pages in the report by either clicking on the pages listed below, or by using the keyword search tool below to find specific information within the annual report.-
 1
1 -
2
-
3
-
4
-
5
-
6
-
7
-
8
-
9
-
10
-
11
-
12
-
13
-
14
-
15
-
16
-
17
-
18
-
19
-
20
-
21
-
22
-
23
-
24
-
25
-
26
-
27
-
28
-
29
-
30
-
31
-
32
-
33
-
34
-
35
-
36
-
37
-
38
-
39
-
40
-
41
-
42
-
43
-
44
-
45
-
46
-
47
-
48
-
49
-
50
-
51
-
52
-
53
-
54
-
55
-
56
-
57
-
58
-
59
-
60
-
61
-
62
-
63
-
64
-
65
-
66
-
67
-
68
-
69
-
70
-
71
-
72
-
73
-
74
-
75
-
76
-
77
-
78
-
79
-
80
-
81
-
82
-
83
-
84
-
85
-
86
-
87
-
88
-
89
-
90
-
91
-
92
-
93
-
94
-
95
-
96
-
97
-
98
-
99
-
100
-
101
-
102
-
103
-
104
-
105
-
106
-
107
-
108
-
109
-
110
-
111
-
112
-
113
-
114
-
115
-
116
-
117
-
118
-
119
-
120
-
121
-
122
-
123
-
124
-
125
-
126
-
127
-
128
-
129
-
130
-
131
-
132
-
133
-
134
-
135
-
136
-
137
-
138
-
139
-
140
-
141
-
142
-
143
-
144
-
145
-
146
-
147
-
148
-
149
-
150
-
151
-
152
-
153
-
154
-
155
-
156
-
157
-
158
-
159
-
160
-
161
-
162
-
163
-
164
-
165
-
166
-
167
-
168
-
169
-
170
-
171
-
172
-
173
-
174
-
175
-
176
-
177
-
178
-
179
-
180
-
181
-
182
-
183
-
184
-
185
-
186
-
187
-
188
-
189
-
190
-
191
-
192
-
193
-
194
-
195
-
 196
196 -
 197
197 -
 198
198 -
 199
199 -
 200
200 -
 201
201 -
 202
202 -
 203
203 -
 204
204 -
 205
205 -
 206
206 -
 207
207 -
 208
208 -
 209
209 -
 210
210 -
 211
211 -
 212
212 -
 213
213 -
 214
214 -
 215
215 -
 216
216 -
217
-
218
-
219
-
220
-
221
-
222
-
223
-
224
-
225
-
226
-
227
-
228
-
229
-
230
-
231
-
232
-
233
-
234
-
235
-
236
-
237
-
238
-
239
-
240
-
241
-
242
-
243
-
244
-
245
-
246
-
247
-
248
-
249
-
250
-
251
-
252
-
253
-
254
-
255
-
256
-
257
-
258
-
259
-
260
-
261
-
262
-
263
-
264
-
265
-
266
-
267
-
268
-
269
-
270
-
271
-
272
 |
 |
200 www.allstate.com
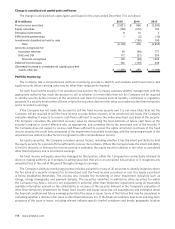
As of December 31, 2015, the remaining $389 million of unrealized losses are related to securities in unrealized loss
positions greater than or equal to 20% of amortized cost or cost. Investment grade fixed income securities comprising
$129 million of these unrealized losses were evaluated based on factors such as discounted cash flows and the financial
condition and near-term and long-term prospects of the issue or issuer and were determined to have adequate resources
to fulfill contractual obligations. Of the $389 million, $215 million are related to below investment grade fixed income
securities and $45 million are related to equity securities. Of these amounts, $16 million are related to below investment
grade fixed income securities that had been in an unrealized loss position greater than or equal to 20% of amortized cost
for a period of twelve or more consecutive months as of December 31, 2015.
ABS, RMBS and CMBS in an unrealized loss position were evaluated based on actual and projected collateral losses
relative to the securities’ positions in the respective securitization trusts, security specific expectations of cash flows, and
credit ratings. This evaluation also takes into consideration credit enhancement, measured in terms of (i) subordination
from other classes of securities in the trust that are contractually obligated to absorb losses before the class of security
the Company owns, (ii) the expected impact of other structural features embedded in the securitization trust beneficial
to the class of securities the Company owns, such as overcollateralization and excess spread, and (iii) for ABS and RMBS
in an unrealized loss position, credit enhancements from reliable bond insurers, where applicable. Municipal bonds in an
unrealized loss position were evaluated based on the underlying credit quality of the primary obligor, obligation type and
quality of the underlying assets. Unrealized losses on equity securities are primarily related to temporary equity market
fluctuations of securities that are expected to recover.
As of December 31, 2015, the Company has not made the decision to sell and it is not more likely than not the
Company will be required to sell fixed income securities with unrealized losses before recovery of the amortized cost
basis. As of December 31, 2015, the Company had the intent and ability to hold equity securities with unrealized losses
for a period of time sufficient for them to recover.
Limited partnerships
As of December 31, 2015 and 2014, the carrying value of equity method limited partnerships totaled $3.72 billion
and $3.41 billion, respectively. The Company recognizes an impairment loss for equity method limited partnerships when
evidence demonstrates that the loss is other than temporary. Evidence of a loss in value that is other than temporary
may include the absence of an ability to recover the carrying amount of the investment or the inability of the investee to
sustain a level of earnings that would justify the carrying amount of the investment.
As of December 31, 2015 and 2014, the carrying value for cost method limited partnerships was $1.15 billion and $1.12
billion, respectively. To determine if an other-than-temporary impairment has occurred, the Company evaluates whether
an impairment indicator has occurred in the period that may have a significant adverse effect on the carrying value of the
investment. Impairment indicators may include: significantly reduced valuations of the investments held by the limited
partnerships; actual recent cash flows received being significantly less than expected cash flows; reduced valuations
based on financing completed at a lower value; completed sale of a material underlying investment at a price significantly
lower than expected; or any other adverse events since the last financial statements received that might affect the fair
value of the investee’s capital. Additionally, the Company’s portfolio monitoring process includes a quarterly review of
all cost method limited partnerships to identify instances where the net asset value is below established thresholds
for certain periods of time, as well as investments that are performing below expectations, for further impairment
consideration. If a cost method limited partnership is other-than-temporarily impaired, the carrying value is written
down to fair value, generally estimated to be equivalent to the reported net asset value.
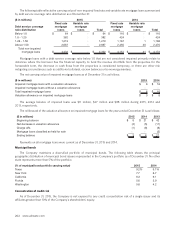
Mortgage loans
The Company’s mortgage loans are commercial mortgage loans collateralized by a variety of commercial real estate
property types located across the United States and totaled, net of valuation allowance, $4.34 billion and $4.19 billion
as of December 31, 2015 and 2014, respectively. Substantially all of the commercial mortgage loans are non-recourse to
the borrower.