Allstate 2015 Annual Report Download - page 35
Download and view the complete annual report
Please find page 35 of the 2015 Allstate annual report below. You can navigate through the pages in the report by either clicking on the pages listed below, or by using the keyword search tool below to find specific information within the annual report.-
 1
1 -
2
-
3
-
4
-
5
-
6
-
7
-
8
-
9
-
10
-
11
-
12
-
13
-
14
-
15
-
16
-
17
-
18
-
19
-
20
-
21
-
22
-
23
-
24
-
 25
25 -
 26
26 -
 27
27 -
 28
28 -
 29
29 -
 30
30 -
 31
31 -
 32
32 -
 33
33 -
 34
34 -
 35
35 -
 36
36 -
 37
37 -
 38
38 -
 39
39 -
 40
40 -
 41
41 -
 42
42 -
 43
43 -
 44
44 -
 45
45 -
46
-
47
-
48
-
49
-
50
-
51
-
52
-
53
-
54
-
55
-
56
-
57
-
58
-
59
-
60
-
61
-
62
-
63
-
64
-
65
-
66
-
67
-
68
-
69
-
70
-
71
-
72
-
73
-
74
-
75
-
76
-
77
-
78
-
79
-
80
-
81
-
82
-
83
-
84
-
85
-
86
-
87
-
88
-
89
-
90
-
91
-
92
-
93
-
94
-
95
-
96
-
97
-
98
-
99
-
100
-
101
-
102
-
103
-
104
-
105
-
106
-
107
-
108
-
109
-
110
-
111
-
112
-
113
-
114
-
115
-
116
-
117
-
118
-
119
-
120
-
121
-
122
-
123
-
124
-
125
-
126
-
127
-
128
-
129
-
130
-
131
-
132
-
133
-
134
-
135
-
136
-
137
-
138
-
139
-
140
-
141
-
142
-
143
-
144
-
145
-
146
-
147
-
148
-
149
-
150
-
151
-
152
-
153
-
154
-
155
-
156
-
157
-
158
-
159
-
160
-
161
-
162
-
163
-
164
-
165
-
166
-
167
-
168
-
169
-
170
-
171
-
172
-
173
-
174
-
175
-
176
-
177
-
178
-
179
-
180
-
181
-
182
-
183
-
184
-
185
-
186
-
187
-
188
-
189
-
190
-
191
-
192
-
193
-
194
-
195
-
196
-
197
-
198
-
199
-
200
-
201
-
202
-
203
-
204
-
205
-
206
-
207
-
208
-
209
-
210
-
211
-
212
-
213
-
214
-
215
-
216
-
217
-
218
-
219
-
220
-
221
-
222
-
223
-
224
-
225
-
226
-
227
-
228
-
229
-
230
-
231
-
232
-
233
-
234
-
235
-
236
-
237
-
238
-
239
-
240
-
241
-
242
-
243
-
244
-
245
-
246
-
247
-
248
-
249
-
250
-
251
-
252
-
253
-
254
-
255
-
256
-
257
-
258
-
259
-
260
-
261
-
262
-
263
-
264
-
265
-
266
-
267
-
268
-
269
-
270
-
271
-
272
 |
 |

The Allstate Corporation 2016 Proxy Statement 29
EXECUTIVE COMPENSATION
COMPENSATION DISCUSSION AND ANALYSIS
EXECUTIVE OVERVIEW
Our Compensation Discussion and Analysis describes Allstate’s executive compensation program, including
total 2015 compensation for our named executives listed below:
Thomas J. Wilson — Chairman and Chief Executive Officer (CEO)
Steven E. Shebik — Executive Vice President and Chief Financial Officer (CFO)
Don Civgin — President, Emerging Businesses of Allstate Insurance Company
Judith P. Greffin — Executive Vice President and Chief Investment Officer of Allstate Insurance Company
Matthew E. Winter — President
See Appendix B for a list of Allstate’s other executive officers. Effective March 31, 2016, Ms. Greffin retired
from Allstate Insurance Company.
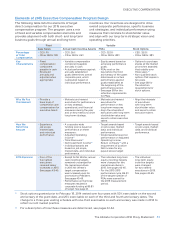
Performance Highlights
In 2015, Allstate encountered an industry-wide increase in the frequency of auto accidents causing
management to shift its operating focus to implementing an auto insurance profit improvement plan. At
the same time, however, Allstate continued its strategy to serve customers with unique value propositions
which enabled it to deliver on near-term commitments, invest in sustainable value creation, and advance all
five operating priorities in 2015:
2015 Operating Priorities
Grow Insurance
Policies in Force
Maintain the
Underlying
Combined Ratio*
Proactively Manage
Investments to
Generate Attractive
Risk-Adjusted
Returns
Modernize the
Operating Model
Build Long-Term
Growth Platforms
• Total Protection
policies in force grew
by 449,000 or 1.3%
in 2015
• Property-liability net
written premium
grew by 4.2% to
$30.9 billion in 2015
• Allstate Financial
policies grew by
322,000 or 6.1%
in 2015 driven by
growth at Allstate
Benefits
• The property-liability
underlying combined
ratio was 88.7, within
the annual outlook
range, but 1.5 points
higher than the prior
year as a result of an
industry-wide increase
in the frequency of
auto accidents
• A multifaceted profit
improvement plan was
put in place to improve
auto returns across
underwriting brands
• Allstate brand
homeowner returns
were strong
• Net investment income
achieved target
• Total return was 1.0%
reflecting low interest
rates, higher credit
spreads and a decline
in equity markets
• Reduced interest rate
risk
• Repositioned Allstate
Financial portfolio
supporting long-dated
liabilities to drive higher
long-term returns
• Lowered expense
ratio in part to
address reduced
auto profitability
• Allstate brand
exclusive agencies
continue to evolve to
trusted advisors
• Expanded
continuous
improvement
programs
• Esurance expanded
geographic
reach and
product portfolio;
homeowners now in
25 states
• Allstate’s Drivewise®
and Esurance’s
DriveSense®
telematics offerings
had over 1 million
active users as of
year-end 2015
• Allstate Benefits
grew premiums and
contract charges by
6.0% and policies by
11.1% in 2015
Results
• Achieved full-year 2015
underlying combined ratio
outlook range by increasing
auto insurance prices,
tightening underwriting
standards, maintaining a strong
homeowners business, and
reducing expenses
• Operating earnings*
per share declined by
3.9% from $5.40 to
$5.19
• Property-liability net
written premiums
increased by $1.3 billion,
resulting from the
additional policies in
force and higher average
premiums per policy
• Common shareholders
received $3.3 billion in cash
returns in 2015 through
common stock dividends and
share repurchases
* The underlying combined ratio and operating earnings measures are not based on accounting principles
generally accepted in the United States of America (“non-GAAP”) and are defined and reconciled to the most
directly comparable GAAP measures in Appendix C.