Allstate 2015 Annual Report Download - page 144
Download and view the complete annual report
Please find page 144 of the 2015 Allstate annual report below. You can navigate through the pages in the report by either clicking on the pages listed below, or by using the keyword search tool below to find specific information within the annual report.-
 1
1 -
2
-
3
-
4
-
5
-
6
-
7
-
8
-
9
-
10
-
11
-
12
-
13
-
14
-
15
-
16
-
17
-
18
-
19
-
20
-
21
-
22
-
23
-
24
-
25
-
26
-
27
-
28
-
29
-
30
-
31
-
32
-
33
-
34
-
35
-
36
-
37
-
38
-
39
-
40
-
41
-
42
-
43
-
44
-
45
-
46
-
47
-
48
-
49
-
50
-
51
-
52
-
53
-
54
-
55
-
56
-
57
-
58
-
59
-
60
-
61
-
62
-
63
-
64
-
65
-
66
-
67
-
68
-
69
-
70
-
71
-
72
-
73
-
74
-
75
-
76
-
77
-
78
-
79
-
80
-
81
-
82
-
83
-
84
-
85
-
86
-
87
-
88
-
89
-
90
-
91
-
92
-
93
-
94
-
95
-
96
-
97
-
98
-
99
-
100
-
101
-
102
-
103
-
104
-
105
-
106
-
107
-
108
-
109
-
110
-
111
-
112
-
113
-
114
-
115
-
116
-
117
-
118
-
119
-
120
-
121
-
122
-
123
-
124
-
125
-
126
-
127
-
128
-
129
-
130
-
131
-
132
-
133
-
 134
134 -
 135
135 -
 136
136 -
 137
137 -
 138
138 -
 139
139 -
 140
140 -
 141
141 -
 142
142 -
 143
143 -
 144
144 -
 145
145 -
 146
146 -
 147
147 -
 148
148 -
 149
149 -
 150
150 -
 151
151 -
 152
152 -
 153
153 -
 154
154 -
155
-
156
-
157
-
158
-
159
-
160
-
161
-
162
-
163
-
164
-
165
-
166
-
167
-
168
-
169
-
170
-
171
-
172
-
173
-
174
-
175
-
176
-
177
-
178
-
179
-
180
-
181
-
182
-
183
-
184
-
185
-
186
-
187
-
188
-
189
-
190
-
191
-
192
-
193
-
194
-
195
-
196
-
197
-
198
-
199
-
200
-
201
-
202
-
203
-
204
-
205
-
206
-
207
-
208
-
209
-
210
-
211
-
212
-
213
-
214
-
215
-
216
-
217
-
218
-
219
-
220
-
221
-
222
-
223
-
224
-
225
-
226
-
227
-
228
-
229
-
230
-
231
-
232
-
233
-
234
-
235
-
236
-
237
-
238
-
239
-
240
-
241
-
242
-
243
-
244
-
245
-
246
-
247
-
248
-
249
-
250
-
251
-
252
-
253
-
254
-
255
-
256
-
257
-
258
-
259
-
260
-
261
-
262
-
263
-
264
-
265
-
266
-
267
-
268
-
269
-
270
-
271
-
272
 |
 |
138 www.allstate.com
liquidity needs, such as auto insurance and discontinued lines and coverages, and capital create capacity to invest in less
liquid higher yielding fixed income securities and limited partnerships, as well as equity securities. Products with higher
liquidity needs, such as homeowners insurance, are invested primarily in high quality liquid fixed income securities.
The Allstate Financial portfolio is comprised of assets chosen to generate returns to support corresponding liabilities,
within an asset-liability framework that targets an appropriate return on capital. For longer-term immediate annuity
liabilities, we invest primarily in performance-based and other equity investments. For shorter-term annuity and life
insurance liabilities, we invest primarily in interest-bearing investments, such as fixed income securities and commercial
mortgage loans.
The Corporate and Other portfolio balances unique liquidity needs related to the overall corporate capital structure
with the pursuit of returns.
Within each segment, we utilize four high level strategies to manage risks and returns and to position our portfolio to
take advantage of market opportunities while attempting to mitigate adverse effects. As strategies and market conditions
evolve, the asset allocation may change or assets may move between strategies.
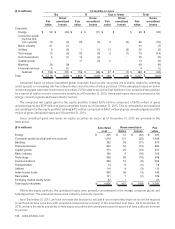
Market-Based Core strategy seeks to deliver predictive earnings aligned to business needs through investments
primarily in public fixed income and equity. Private fixed income assets, such as commercial mortgages, bank loans
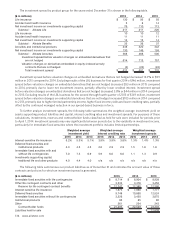
and privately placed debt are also included in this category. As of December 31, 2015, 83% of the portfolio follows this
strategy with 86% in fixed income securities and mortgage loans and 7% in equity securities, including $1 billion of
equity securities that we may not hold for a period of time sufficient to recover unrealized losses.
Market-Based Active strategy seeks to outperform within the public markets through tactical positioning and by
taking advantage of short-term opportunities. This strategy may generate results that meaningfully deviate from those
achieved by market indices, both favorably and unfavorably. The portfolio primarily includes public fixed income and
equity. As of December 31, 2015, 10% of the portfolio follows this strategy with 82% in fixed income securities and 9%
in equity securities, including $728 million of equity securities that we may not hold for a period of time sufficient to
recover unrealized losses.
Performance-Based Long-Term (“PBLT”) strategy seeks to deliver attractive risk-adjusted returns over a longer horizon.
The achieved return is a function of both general market conditions and the performance of the underlying assets or
businesses. The portfolio, which primarily includes private equity, real estate, infrastructure, timber and agriculture-
related assets, is diversified across a number of characteristics, including managers or partners, vintage years, strategies,
geographies (including international) and industry sectors or property types. These investments are generally illiquid in
nature, often require specialized expertise, typically involve a third party manager, and may offer the potential to add
value through transformation at the company or property level. As of December 31, 2015, 7% of the portfolio follows this
strategy with 89% in limited partnership interests.
Performance-Based Opportunistic strategy seeks to earn attractive returns by making investments that involve asset
dislocations or special situations, often in private markets. The portfolio primarily includes distressed and event driven
assets primarily in fixed income and equity.
Investments outlook
The FOMC raised the federal funds target rate in December 2015 for the first time since December 2008, and in
January 2016, the FOMC left the rate unchanged. We anticipate that interest rates will continue to increase but remain
below historic averages for an extended period of time and that financial markets will continue to have periods of high
volatility and less liquidity. Invested assets and income are expected to decline in line with reductions in contractholder
funds for the Allstate Financial segment. Additionally, investment income will decline as a result of maturity profile
shortening in 2015 to reduce the risk of rising interest rates in Allstate Financial and as we continue to invest and reinvest
investment proceeds at market yields that are below the current portfolio yield. We plan to focus on the following priorities:
• Expanding our capabilities in performance-based investing to increase portfolio returns and capital creation
and taking advantage of increased market volatility through higher allocation to market-based active strategies.
• Continue to shift the portfolio mix to include more performance-based investments, primarily private equity,
real estate, infrastructure, timber and agriculture-related assets. A greater proportion of the return on these
investments is derived from idiosyncratic asset or operating performance. While we anticipate higher returns
on these investments over time, the investment income can vary significantly between periods.
• Investing for the specific needs and characteristics of Allstate’s businesses, including its corresponding
liability profile.