Allstate 2015 Annual Report Download - page 201
Download and view the complete annual report
Please find page 201 of the 2015 Allstate annual report below. You can navigate through the pages in the report by either clicking on the pages listed below, or by using the keyword search tool below to find specific information within the annual report.-
 1
1 -
2
-
3
-
4
-
5
-
6
-
7
-
8
-
9
-
10
-
11
-
12
-
13
-
14
-
15
-
16
-
17
-
18
-
19
-
20
-
21
-
22
-
23
-
24
-
25
-
26
-
27
-
28
-
29
-
30
-
31
-
32
-
33
-
34
-
35
-
36
-
37
-
38
-
39
-
40
-
41
-
42
-
43
-
44
-
45
-
46
-
47
-
48
-
49
-
50
-
51
-
52
-
53
-
54
-
55
-
56
-
57
-
58
-
59
-
60
-
61
-
62
-
63
-
64
-
65
-
66
-
67
-
68
-
69
-
70
-
71
-
72
-
73
-
74
-
75
-
76
-
77
-
78
-
79
-
80
-
81
-
82
-
83
-
84
-
85
-
86
-
87
-
88
-
89
-
90
-
91
-
92
-
93
-
94
-
95
-
96
-
97
-
98
-
99
-
100
-
101
-
102
-
103
-
104
-
105
-
106
-
107
-
108
-
109
-
110
-
111
-
112
-
113
-
114
-
115
-
116
-
117
-
118
-
119
-
120
-
121
-
122
-
123
-
124
-
125
-
126
-
127
-
128
-
129
-
130
-
131
-
132
-
133
-
134
-
135
-
136
-
137
-
138
-
139
-
140
-
141
-
142
-
143
-
144
-
145
-
146
-
147
-
148
-
149
-
150
-
151
-
152
-
153
-
154
-
155
-
156
-
157
-
158
-
159
-
160
-
161
-
162
-
163
-
164
-
165
-
166
-
167
-
168
-
169
-
170
-
171
-
172
-
173
-
174
-
175
-
176
-
177
-
178
-
179
-
180
-
181
-
182
-
183
-
184
-
185
-
186
-
187
-
188
-
189
-
190
-
 191
191 -
 192
192 -
 193
193 -
 194
194 -
 195
195 -
 196
196 -
 197
197 -
 198
198 -
 199
199 -
 200
200 -
 201
201 -
 202
202 -
 203
203 -
 204
204 -
 205
205 -
 206
206 -
 207
207 -
 208
208 -
 209
209 -
 210
210 -
 211
211 -
212
-
213
-
214
-
215
-
216
-
217
-
218
-
219
-
220
-
221
-
222
-
223
-
224
-
225
-
226
-
227
-
228
-
229
-
230
-
231
-
232
-
233
-
234
-
235
-
236
-
237
-
238
-
239
-
240
-
241
-
242
-
243
-
244
-
245
-
246
-
247
-
248
-
249
-
250
-
251
-
252
-
253
-
254
-
255
-
256
-
257
-
258
-
259
-
260
-
261
-
262
-
263
-
264
-
265
-
266
-
267
-
268
-
269
-
270
-
271
-
272
 |
 |

The Allstate Corporation 2015 Annual Report 195
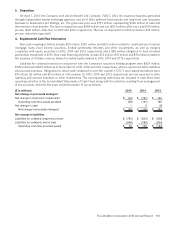
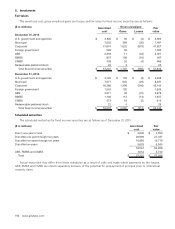
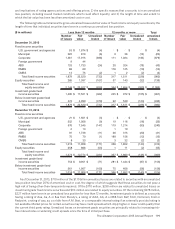
Net investment income
Net investment income for the years ended December 31 is as follows:
($ in millions) 2015 2014 2013
Fixed income securities $ 2,218 $ 2,447 $ 2,921
Equity securities 110 117 149
Mortgage loans 228 265 372
Limited partnership interests 549 614 541
Short‑term investments 9 7 5
Other 192 170 161
Investment income, before expense 3,306 3,620 4,149
Investment expense (150) (161) (206)
Net investment income $ 3,156 $ 3,459 $ 3,943
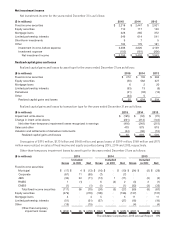
Realized capital gains and losses
Realized capital gains and losses by asset type for the years ended December 31 are as follows:
($ in millions) 2015 2014 2013
Fixed income securities $ 212 $ 130 $ 262
Equity securities (50) 582 327
Mortgage loans 6 2 20
Limited partnership interests (93) 13 (5)
Derivatives (21) (38) (10)
Other (24) 5 —
Realized capital gains and losses $ 30 $ 694 $ 594
Realized capital gains and losses by transaction type for the years ended December 31 are as follows:
($ in millions) 2015 2014 2013
Impairment write‑downs $ (195) $ (32) $ (72)
Change in intent write‑downs (221) (213) (143)
Net other‑than‑temporary impairment losses recognized in earnings (416) (245) (215)
Sales and other 470 975 819
Valuation and settlements of derivative instruments (24) (36) (10)
Realized capital gains and losses $ 30 $ 694 $ 594
Gross gains of $915 million, $1.10 billion and $968 million and gross losses of $399 million, $169 million and $175
million were realized on sales of fixed income and equity securities during 2015, 2014 and 2013, respectively.
Other-than-temporary impairment losses by asset type for the years ended December 31 are as follows:
($ in millions) 2015 2014 2013
Gross
Included
in OCI Net Gross
Included
in OCI Net Gross
Included
in OCI Net
Fixed income securities:
Municipal $ (17) $ 4 $ (13) $ (10) $ — $ (10) $ (24) $ (5) $ (29)
Corporate (61) 11 (50) (7) — (7) — — —
ABS (33) 22 (11) (12) 1 (11) — (2) (2)
RMBS 1 (1) — 6 (4) 2 (3) 2 (1)
CMBS (1) — (1) (1) — (1) (32) (3) (35)
Total fixed income securities (111) 36 (75) (24) (3) (27) (59) (8) (67)
Equity securities (279) — (279) (196) — (196) (137) — (137)
Mortgage loans 4 — 4 5 — 5 11 — 11
Limited partnership interests (51) — (51) (27) — (27) (18) — (18)
Other (15) — (15) — — — (4) — (4)
Other‑than‑temporary
impairment losses $ (452) $ 36 $ (416) $ (242) $ (3) $ (245) $ (207) $ (8) $ (215)