Allstate 2015 Annual Report Download - page 223
Download and view the complete annual report
Please find page 223 of the 2015 Allstate annual report below. You can navigate through the pages in the report by either clicking on the pages listed below, or by using the keyword search tool below to find specific information within the annual report.-
 1
1 -
2
-
3
-
4
-
5
-
6
-
7
-
8
-
9
-
10
-
11
-
12
-
13
-
14
-
15
-
16
-
17
-
18
-
19
-
20
-
21
-
22
-
23
-
24
-
25
-
26
-
27
-
28
-
29
-
30
-
31
-
32
-
33
-
34
-
35
-
36
-
37
-
38
-
39
-
40
-
41
-
42
-
43
-
44
-
45
-
46
-
47
-
48
-
49
-
50
-
51
-
52
-
53
-
54
-
55
-
56
-
57
-
58
-
59
-
60
-
61
-
62
-
63
-
64
-
65
-
66
-
67
-
68
-
69
-
70
-
71
-
72
-
73
-
74
-
75
-
76
-
77
-
78
-
79
-
80
-
81
-
82
-
83
-
84
-
85
-
86
-
87
-
88
-
89
-
90
-
91
-
92
-
93
-
94
-
95
-
96
-
97
-
98
-
99
-
100
-
101
-
102
-
103
-
104
-
105
-
106
-
107
-
108
-
109
-
110
-
111
-
112
-
113
-
114
-
115
-
116
-
117
-
118
-
119
-
120
-
121
-
122
-
123
-
124
-
125
-
126
-
127
-
128
-
129
-
130
-
131
-
132
-
133
-
134
-
135
-
136
-
137
-
138
-
139
-
140
-
141
-
142
-
143
-
144
-
145
-
146
-
147
-
148
-
149
-
150
-
151
-
152
-
153
-
154
-
155
-
156
-
157
-
158
-
159
-
160
-
161
-
162
-
163
-
164
-
165
-
166
-
167
-
168
-
169
-
170
-
171
-
172
-
173
-
174
-
175
-
176
-
177
-
178
-
179
-
180
-
181
-
182
-
183
-
184
-
185
-
186
-
187
-
188
-
189
-
190
-
191
-
192
-
193
-
194
-
195
-
196
-
197
-
198
-
199
-
200
-
201
-
202
-
203
-
204
-
205
-
206
-
207
-
208
-
209
-
210
-
211
-
212
-
 213
213 -
 214
214 -
 215
215 -
 216
216 -
 217
217 -
 218
218 -
 219
219 -
 220
220 -
 221
221 -
 222
222 -
 223
223 -
 224
224 -
 225
225 -
 226
226 -
 227
227 -
 228
228 -
 229
229 -
 230
230 -
 231
231 -
 232
232 -
 233
233 -
234
-
235
-
236
-
237
-
238
-
239
-
240
-
241
-
242
-
243
-
244
-
245
-
246
-
247
-
248
-
249
-
250
-
251
-
252
-
253
-
254
-
255
-
256
-
257
-
258
-
259
-
260
-
261
-
262
-
263
-
264
-
265
-
266
-
267
-
268
-
269
-
270
-
271
-
272
 |
 |

The Allstate Corporation 2015 Annual Report 217
The following table provides gross and net amounts for the Company’s OTC derivatives, all of which are subject to
enforceable master netting agreements.
($ in millions) Offsets
Gross
amount
Counter-
party
netting
Cash
collateral
(received)
pledged
Net
amount on
balance
sheet
Securities
collateral
(received)
pledged
Net
amount
December 31, 2015
Asset derivatives $ 21 $ (8) $ (5) $ 8 $ (4) $ 4
Liability derivatives (25) 8 (1) (18) 9 (9)
December 31, 2014
Asset derivatives $ 12 $ (22) $ 17 $ 7 $ (4) $ 3
Liability derivatives (35) 22 — (13) 8 (5)
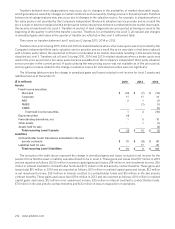
The following table provides a summary of the impacts of the Company’s foreign currency contracts in cash flow
hedging relationships for the years ended December31. Amortization of net gains from accumulated other comprehensive
income related to cash flow hedges is expected to be a gain of $3million during the next twelve months. There was no
hedge ineffectiveness reported in realized gains and losses in 2015, 2014 or 2013.
($ in millions) 2015 2014 2013
Gain recognized in OCI on derivatives during the period $ 10 $ 12 $ 3
Gain (loss) recognized in OCI on derivatives during the term
of the hedging relationship 6 (2) (18)
Loss reclassified from AOCI into income (net investment income) (1) (2) (1)
Gain (loss) reclassified from AOCI into income (realized capital gains
and losses) 3 (2) —
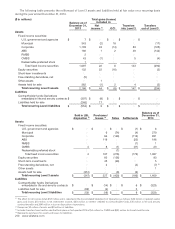
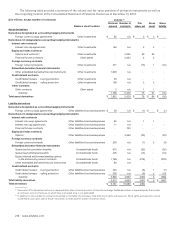
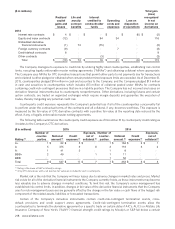
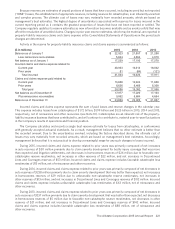
The following tables present gains and losses from valuation and settlements reported on derivatives not designated
as accounting hedging instruments in the Consolidated Statements of Operations. In 2015, 2014 and 2013, the Company
had no derivatives used in fair value hedging relationships.
($ in millions)
Realized
capital
gains and
losses
Life and
annuity
contract
benefits
Interest
credited to
contractholder
funds
Operating
costs and
expenses
Loss on
disposition
of operations
Total gain
(loss)
recognized
in net
income on
derivatives
2015
Interest rate contracts $ 1 $ — $ — $ — $ — $ 1
Equity and index contracts 1 — (9) (1) — (9)
Embedded derivative
financial instruments — (7) 31 — — 24
Foreign currency contracts (24) — — (8) — (32)
Credit default contracts (2) — — — — (2)
Other contracts — — — — — —
Total $ (24) $ (7) $ 22 $ (9) $ — $ (18)
2014
Interest rate contracts $ (10) $ — $ — $ — $ (4) $ (14)
Equity and index contracts (18) — 38 9 — 29
Embedded derivative
financial instruments
— 15 (14) — — 1
Foreign currency contracts (9) — — (8) — (17)
Credit default contracts 1 — — — — 1
Other contracts — — (2) — — (2)
Total $ (36) $ 15 $ 22 $ 1 $ (4) $ (2)