Allstate 2015 Annual Report Download - page 36
Download and view the complete annual report
Please find page 36 of the 2015 Allstate annual report below. You can navigate through the pages in the report by either clicking on the pages listed below, or by using the keyword search tool below to find specific information within the annual report.-
 1
1 -
2
-
3
-
4
-
5
-
6
-
7
-
8
-
9
-
10
-
11
-
12
-
13
-
14
-
15
-
16
-
17
-
18
-
19
-
20
-
21
-
22
-
23
-
24
-
25
-
 26
26 -
 27
27 -
 28
28 -
 29
29 -
 30
30 -
 31
31 -
 32
32 -
 33
33 -
 34
34 -
 35
35 -
 36
36 -
 37
37 -
 38
38 -
 39
39 -
 40
40 -
 41
41 -
 42
42 -
 43
43 -
 44
44 -
 45
45 -
 46
46 -
47
-
48
-
49
-
50
-
51
-
52
-
53
-
54
-
55
-
56
-
57
-
58
-
59
-
60
-
61
-
62
-
63
-
64
-
65
-
66
-
67
-
68
-
69
-
70
-
71
-
72
-
73
-
74
-
75
-
76
-
77
-
78
-
79
-
80
-
81
-
82
-
83
-
84
-
85
-
86
-
87
-
88
-
89
-
90
-
91
-
92
-
93
-
94
-
95
-
96
-
97
-
98
-
99
-
100
-
101
-
102
-
103
-
104
-
105
-
106
-
107
-
108
-
109
-
110
-
111
-
112
-
113
-
114
-
115
-
116
-
117
-
118
-
119
-
120
-
121
-
122
-
123
-
124
-
125
-
126
-
127
-
128
-
129
-
130
-
131
-
132
-
133
-
134
-
135
-
136
-
137
-
138
-
139
-
140
-
141
-
142
-
143
-
144
-
145
-
146
-
147
-
148
-
149
-
150
-
151
-
152
-
153
-
154
-
155
-
156
-
157
-
158
-
159
-
160
-
161
-
162
-
163
-
164
-
165
-
166
-
167
-
168
-
169
-
170
-
171
-
172
-
173
-
174
-
175
-
176
-
177
-
178
-
179
-
180
-
181
-
182
-
183
-
184
-
185
-
186
-
187
-
188
-
189
-
190
-
191
-
192
-
193
-
194
-
195
-
196
-
197
-
198
-
199
-
200
-
201
-
202
-
203
-
204
-
205
-
206
-
207
-
208
-
209
-
210
-
211
-
212
-
213
-
214
-
215
-
216
-
217
-
218
-
219
-
220
-
221
-
222
-
223
-
224
-
225
-
226
-
227
-
228
-
229
-
230
-
231
-
232
-
233
-
234
-
235
-
236
-
237
-
238
-
239
-
240
-
241
-
242
-
243
-
244
-
245
-
246
-
247
-
248
-
249
-
250
-
251
-
252
-
253
-
254
-
255
-
256
-
257
-
258
-
259
-
260
-
261
-
262
-
263
-
264
-
265
-
266
-
267
-
268
-
269
-
270
-
271
-
272
 |
 |

30 www.allstate.com
EXECUTIVE COMPENSATION
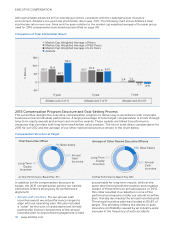
Although Allstate advanced all five operating priorities, consistent with the challenging auto insurance
environment, Allstate’s one year total stockholder return was -9.9%. The following chart shows Allstate’s total
stockholder return over one, three and five years relative to the market cap weighted average of the peer group
used for 2015 compensation benchmarking (identified on page 39).
Comparison of Total Stockholder Return
Market Cap Weighted Average of P&C Peers
Market Cap Weighted Average of Life Peers
% Return
Allstate
Market Cap Weighted Average of Peers
65.3 76.4
40.1
116.3
63.1 70.9 60.8 63.0
3.4 7.2
(1.7) (9.9)
5-year
Allstate rank 3 of 11 Allstate rank 7 of 11 Allstate rank 10 of 11
3-year 1-year
-50
0
50
100
150
2015 Compensation Program Structure and Goal-Setting Process
The committee designs the executive compensation program to deliver pay in accordance with corporate,
business unit and individual performance. A large percentage of total target compensation is at risk through
long-term equity awards and annual cash incentive awards. These awards are linked to performance
measures that correlate with long-term stockholder value creation. The mix of total direct compensation for
2015 for our CEO and the average of our other named executives is shown in the chart below.
Compensation Structure at Target
Base Salary
At-Risk Performance-Based Pay: 91%
Chief Executive Officer
Annual
Cash
Incentive
Long-Term
Equity
Incentive
9%
26%
65%
Base Salary
Average of Other Named Executive Officers
Annual
Cash
Incentive
Long-Term
Equity
Incentive
18%
26%
56%
At-Risk Performance-Based Pay: 82%
In addition to the compensation structure at
target, the 2015 compensation paid to our named
executives reflects strong pay for performance
alignment:
• Annual cash incentive. For our annual cash
incentive award, we set performance ranges to
align with our operating plan. We also included
a “collar” for the sum of catastrophe and limited
partnership income components of the annual
incentive plan to ensure that management is held
accountable for long-term results, while at the
same time limiting both the positive and negative
impact of these items on annual payouts. In 2015,
this collar resulted in a reduction in one of the
performance measures under our annual incentive
plan, thereby decreasing the annual incentive pool.
The annual incentive plan was funded at 80.8% of
target. This primarily reflects the decline in auto
insurance profitability caused by an industry-wide
increase in the frequency of auto accidents.