Allstate 2015 Annual Report Download - page 104
Download and view the complete annual report
Please find page 104 of the 2015 Allstate annual report below. You can navigate through the pages in the report by either clicking on the pages listed below, or by using the keyword search tool below to find specific information within the annual report.-
 1
1 -
2
-
3
-
4
-
5
-
6
-
7
-
8
-
9
-
10
-
11
-
12
-
13
-
14
-
15
-
16
-
17
-
18
-
19
-
20
-
21
-
22
-
23
-
24
-
25
-
26
-
27
-
28
-
29
-
30
-
31
-
32
-
33
-
34
-
35
-
36
-
37
-
38
-
39
-
40
-
41
-
42
-
43
-
44
-
45
-
46
-
47
-
48
-
49
-
50
-
51
-
52
-
53
-
54
-
55
-
56
-
57
-
58
-
59
-
60
-
61
-
62
-
63
-
64
-
65
-
66
-
67
-
68
-
69
-
70
-
71
-
72
-
73
-
74
-
75
-
76
-
77
-
78
-
79
-
80
-
81
-
82
-
83
-
84
-
85
-
86
-
87
-
88
-
89
-
90
-
91
-
92
-
93
-
 94
94 -
 95
95 -
 96
96 -
 97
97 -
 98
98 -
 99
99 -
 100
100 -
 101
101 -
 102
102 -
 103
103 -
 104
104 -
 105
105 -
 106
106 -
 107
107 -
 108
108 -
 109
109 -
 110
110 -
 111
111 -
 112
112 -
 113
113 -
 114
114 -
115
-
116
-
117
-
118
-
119
-
120
-
121
-
122
-
123
-
124
-
125
-
126
-
127
-
128
-
129
-
130
-
131
-
132
-
133
-
134
-
135
-
136
-
137
-
138
-
139
-
140
-
141
-
142
-
143
-
144
-
145
-
146
-
147
-
148
-
149
-
150
-
151
-
152
-
153
-
154
-
155
-
156
-
157
-
158
-
159
-
160
-
161
-
162
-
163
-
164
-
165
-
166
-
167
-
168
-
169
-
170
-
171
-
172
-
173
-
174
-
175
-
176
-
177
-
178
-
179
-
180
-
181
-
182
-
183
-
184
-
185
-
186
-
187
-
188
-
189
-
190
-
191
-
192
-
193
-
194
-
195
-
196
-
197
-
198
-
199
-
200
-
201
-
202
-
203
-
204
-
205
-
206
-
207
-
208
-
209
-
210
-
211
-
212
-
213
-
214
-
215
-
216
-
217
-
218
-
219
-
220
-
221
-
222
-
223
-
224
-
225
-
226
-
227
-
228
-
229
-
230
-
231
-
232
-
233
-
234
-
235
-
236
-
237
-
238
-
239
-
240
-
241
-
242
-
243
-
244
-
245
-
246
-
247
-
248
-
249
-
250
-
251
-
252
-
253
-
254
-
255
-
256
-
257
-
258
-
259
-
260
-
261
-
262
-
263
-
264
-
265
-
266
-
267
-
268
-
269
-
270
-
271
-
272
 |
 |

98 www.allstate.com
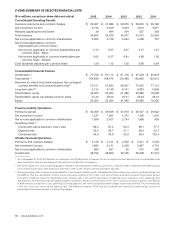
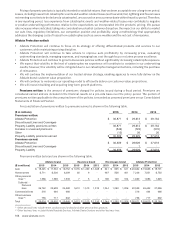
2015 HIGHLIGHTS
• Consolidated net income applicable to common shareholders was $2.06 billion in 2015 compared to $2.75 billion in
2014. Net income applicable to common shareholders per diluted common share was $5.05 in 2015 compared to $6.27
in 2014.
• Property-Liability net income applicable to common shareholders was $1.69 billion in 2015 compared to $2.43 billion
in 2014.
• The Property-Liability combined ratio was 94.9 in 2015 compared to 93.9 in 2014.
• Allstate Financial net income applicable to common shareholders was $663 million in 2015 compared to $631 million
in 2014.
• Total revenues were $35.65 billion in 2015 compared to $35.24 billion in 2014.
• Property-Liability premiums earned totaled $30.31 billion in 2015, an increase of 4.8% from $28.93 billion in 2014.
• Investments totaled $77.76 billion as of December31, 2015, decreasing from $81.11 billion as of December31, 2014.
Net investment income was $3.16 billion in 2015, a decrease of 8.8% from $3.46 billion in 2014.
• Net realized capital gains were $30 million in 2015 compared to $694 million in 2014.
• Book value per diluted common share (ratio of common shareholders’ equity to total common shares outstanding and
dilutive potential common shares outstanding) was $47.34 as of December31, 2015, a decrease of 1.9% from $48.24
as of December31, 2014.
• For the twelve months ended December31, 2015, return on the average of beginning and ending period common
shareholders’ equity of 10.6% decreased by 2.7 points from 13.3% for the twelve months ended December31, 2014.
• As of December31, 2015, shareholders’ equity was $20.03 billion. This total included $2.62billion in deployable
assets at the parent holding company level comprising cash and investments that are generally saleable within
one quarter.
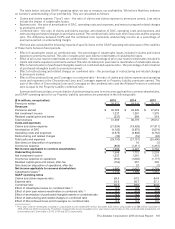
CONSOLIDATED NET INCOME
($ in millions) 2015 2014 2013
Revenues
Property‑liability insurance premiums $ 30,309 $ 28,929 $ 27,618
Life and annuity premiums and contract charges 2,158 2,157 2,352
Net investment income 3,156 3,459 3,943
Realized capital gains and losses:
Total other‑than‑temporary impairment (“OTTI”) losses (452) (242) (207)
OTTI losses reclassified to (from) other comprehensive income 36 (3) (8)
Net OTTI losses recognized in earnings (416) (245) (215)
Sales and other realized capital gains and losses 446 939 809
Total realized capital gains and losses 30 694 594
Total revenues 35,653 35,239 34,507
Costs and expenses
Property‑liability insurance claims and claims expense (21,034) (19,428) (17,911)
Life and annuity contract benefits (1,803) (1,765) (1,917)
Interest credited to contractholder funds (761) (919) (1,278)
Amortization of deferred policy acquisition costs (4,364) (4,135) (4,002)
Operating costs and expenses (4,081) (4,341) (4,387)
Restructuring and related charges (39) (18) (70)
Loss on extinguishment of debt — (1) (491)
Interest expense (292) (322) (367)
Total costs and expenses (32,374) (30,929) (30,423)
Gain (loss) on disposition of operations 3 (74) (688)
Income tax expense (1,111) (1,386) (1,116)
Net income 2,171 2,850 2,280
Preferred stock dividends (116) (104) (17)
Net income applicable to common shareholders $ 2,055 $ 2,746 $ 2,263
Property‑Liability $ 1,690 $ 2,427 $ 2,754
Allstate Financial 663 631 95
Corporate and Other (298) (312) (586)
Net income applicable to common shareholders $ 2,055 $ 2,746 $ 2,263