Allstate 2015 Annual Report Download - page 257
Download and view the complete annual report
Please find page 257 of the 2015 Allstate annual report below. You can navigate through the pages in the report by either clicking on the pages listed below, or by using the keyword search tool below to find specific information within the annual report.-
 1
1 -
2
-
3
-
4
-
5
-
6
-
7
-
8
-
9
-
10
-
11
-
12
-
13
-
14
-
15
-
16
-
17
-
18
-
19
-
20
-
21
-
22
-
23
-
24
-
25
-
26
-
27
-
28
-
29
-
30
-
31
-
32
-
33
-
34
-
35
-
36
-
37
-
38
-
39
-
40
-
41
-
42
-
43
-
44
-
45
-
46
-
47
-
48
-
49
-
50
-
51
-
52
-
53
-
54
-
55
-
56
-
57
-
58
-
59
-
60
-
61
-
62
-
63
-
64
-
65
-
66
-
67
-
68
-
69
-
70
-
71
-
72
-
73
-
74
-
75
-
76
-
77
-
78
-
79
-
80
-
81
-
82
-
83
-
84
-
85
-
86
-
87
-
88
-
89
-
90
-
91
-
92
-
93
-
94
-
95
-
96
-
97
-
98
-
99
-
100
-
101
-
102
-
103
-
104
-
105
-
106
-
107
-
108
-
109
-
110
-
111
-
112
-
113
-
114
-
115
-
116
-
117
-
118
-
119
-
120
-
121
-
122
-
123
-
124
-
125
-
126
-
127
-
128
-
129
-
130
-
131
-
132
-
133
-
134
-
135
-
136
-
137
-
138
-
139
-
140
-
141
-
142
-
143
-
144
-
145
-
146
-
147
-
148
-
149
-
150
-
151
-
152
-
153
-
154
-
155
-
156
-
157
-
158
-
159
-
160
-
161
-
162
-
163
-
164
-
165
-
166
-
167
-
168
-
169
-
170
-
171
-
172
-
173
-
174
-
175
-
176
-
177
-
178
-
179
-
180
-
181
-
182
-
183
-
184
-
185
-
186
-
187
-
188
-
189
-
190
-
191
-
192
-
193
-
194
-
195
-
196
-
197
-
198
-
199
-
200
-
201
-
202
-
203
-
204
-
205
-
206
-
207
-
208
-
209
-
210
-
211
-
212
-
213
-
214
-
215
-
216
-
217
-
218
-
219
-
220
-
221
-
222
-
223
-
224
-
225
-
226
-
227
-
228
-
229
-
230
-
231
-
232
-
233
-
234
-
235
-
236
-
237
-
238
-
239
-
240
-
241
-
242
-
243
-
244
-
245
-
246
-
 247
247 -
 248
248 -
 249
249 -
 250
250 -
 251
251 -
 252
252 -
 253
253 -
 254
254 -
 255
255 -
 256
256 -
 257
257 -
 258
258 -
 259
259 -
 260
260 -
 261
261 -
 262
262 -
 263
263 -
 264
264 -
 265
265 -
 266
266 -
 267
267 -
268
-
269
-
270
-
271
-
272
 |
 |

The Allstate Corporation 2015 Annual Report 251
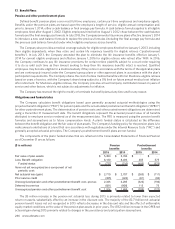
The fair values of pension plan assets are estimated using the same methodologies and inputs as those used to
determine the fair values for the respective asset category of the Company. These methodologies and inputs are disclosed
in Note6.
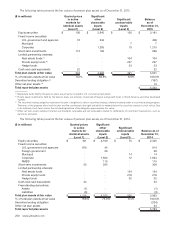
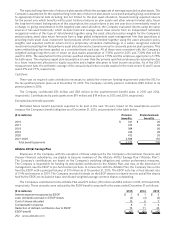
The following table presents the rollforward of Level3 plan assets for the year ended December31, 2015.
($ in millions) Actual return on plan
assets:
Balance as of
December 31,
2014
Relating
to assets
sold during
the period
Relating to
assets still
held at the
reporting
date
Purchases,
sales and
settlements,
net
Net
transfers in
and/or (out)
of Level 3
Balance as of
December 31,
2015
Equity securities $ 75 $ 1 $ (5) $ 29 $ — $ 100
Fixed income securities:
Municipal 14 — — (7) — 7
Corporate 12 — — — (2) 10
Limited partnership interests:
Real estate funds 154 — (12) (38) — 104
Private equity funds 218 — (8) 27 — 237
Hedge funds 32 — 1 — — 33
Total Level 3 plan assets $ 505 $ 1 $ (24) $ 11 $ (2) $ 491
The following table presents the rollforward of Level3 plan assets for the year ended December31, 2014.
($ in millions) Actual return on plan
assets:
Balance as of
December 31,
2013
Relating
to assets
sold during
the period
Relating to
assets still
held at the
reporting
date
Purchases,
sales and
settlements,
net
Net
transfers in
and/or (out)
of Level 3
Balance as of
December 31,
2014
Equity securities $ 237 $ 2 $ 2 $ (166)$ — $ 75
Fixed income securities:
Municipal 18 — — (4)— 14
Corporate 18 — — (6)— 12
Limited partnership interests:
Real estate funds 197 (3)6 (46)— 154
Private equity funds 211 (4)4 7 — 218
Hedge funds 9 — — 23 — 32
Total Level 3 plan assets $ 690 $ (5)$ 12 $ (192)$ — $ 505
The following table presents the rollforward of Level3 plan assets for the year ended December31, 2013.
($ in millions) Actual return on plan
assets:
Balance as of
December 31,
2012
Relating
to assets
sold during
the period
Relating to
assets still
held at the
reporting
date
Purchases,
sales and
settlements,
net
Net
transfers in
and/or (out)
of Level 3
Balance as of
December 31,
2013
Equity securities $ 314 $ 3 $ 18 $ (98) $ — $ 237
Fixed income securities:
Municipal 129 7 1 (119) — 18
Corporate 10 5 — 3 — 18
Limited partnership interests:
Real estate funds 214 — 11 (28) — 197
Private equity funds 199 — (2) 14 — 211
Hedge funds 80 — — (71) — 9
Total Level 3 plan assets $ 946 $ 15 $ 28 $ (299) $ — $ 690