Allstate 2015 Annual Report Download - page 129
Download and view the complete annual report
Please find page 129 of the 2015 Allstate annual report below. You can navigate through the pages in the report by either clicking on the pages listed below, or by using the keyword search tool below to find specific information within the annual report.-
 1
1 -
2
-
3
-
4
-
5
-
6
-
7
-
8
-
9
-
10
-
11
-
12
-
13
-
14
-
15
-
16
-
17
-
18
-
19
-
20
-
21
-
22
-
23
-
24
-
25
-
26
-
27
-
28
-
29
-
30
-
31
-
32
-
33
-
34
-
35
-
36
-
37
-
38
-
39
-
40
-
41
-
42
-
43
-
44
-
45
-
46
-
47
-
48
-
49
-
50
-
51
-
52
-
53
-
54
-
55
-
56
-
57
-
58
-
59
-
60
-
61
-
62
-
63
-
64
-
65
-
66
-
67
-
68
-
69
-
70
-
71
-
72
-
73
-
74
-
75
-
76
-
77
-
78
-
79
-
80
-
81
-
82
-
83
-
84
-
85
-
86
-
87
-
88
-
89
-
90
-
91
-
92
-
93
-
94
-
95
-
96
-
97
-
98
-
99
-
100
-
101
-
102
-
103
-
104
-
105
-
106
-
107
-
108
-
109
-
110
-
111
-
112
-
113
-
114
-
115
-
116
-
117
-
118
-
 119
119 -
 120
120 -
 121
121 -
 122
122 -
 123
123 -
 124
124 -
 125
125 -
 126
126 -
 127
127 -
 128
128 -
 129
129 -
 130
130 -
 131
131 -
 132
132 -
 133
133 -
 134
134 -
 135
135 -
 136
136 -
 137
137 -
 138
138 -
 139
139 -
140
-
141
-
142
-
143
-
144
-
145
-
146
-
147
-
148
-
149
-
150
-
151
-
152
-
153
-
154
-
155
-
156
-
157
-
158
-
159
-
160
-
161
-
162
-
163
-
164
-
165
-
166
-
167
-
168
-
169
-
170
-
171
-
172
-
173
-
174
-
175
-
176
-
177
-
178
-
179
-
180
-
181
-
182
-
183
-
184
-
185
-
186
-
187
-
188
-
189
-
190
-
191
-
192
-
193
-
194
-
195
-
196
-
197
-
198
-
199
-
200
-
201
-
202
-
203
-
204
-
205
-
206
-
207
-
208
-
209
-
210
-
211
-
212
-
213
-
214
-
215
-
216
-
217
-
218
-
219
-
220
-
221
-
222
-
223
-
224
-
225
-
226
-
227
-
228
-
229
-
230
-
231
-
232
-
233
-
234
-
235
-
236
-
237
-
238
-
239
-
240
-
241
-
242
-
243
-
244
-
245
-
246
-
247
-
248
-
249
-
250
-
251
-
252
-
253
-
254
-
255
-
256
-
257
-
258
-
259
-
260
-
261
-
262
-
263
-
264
-
265
-
266
-
267
-
268
-
269
-
270
-
271
-
272
 |
 |

The Allstate Corporation 2015 Annual Report 123
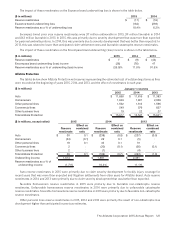
Reserve additions for asbestos in 2015 were primarily related to a settlement with a large insured and more reported
claims than expected. Reserve additions for asbestos in 2014 were primarily related to more reported claims than
expected and increased severity including claims from certain large insurance programs. Reserve additions for asbestos
in 2013 were primarily related to a cedent’s settlement with a bankrupt insured of asbestos claims in excess of a previously
advised amount and loss trends from other claims.
Reserve additions for environmental in 2014 were primarily related to greater reported loss activity than expected.
Reserve additions for environmental in 2013 were primarily related to an adverse court ruling for site-specific disputed
coverage.
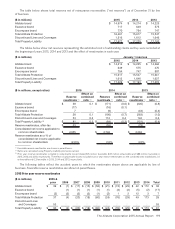
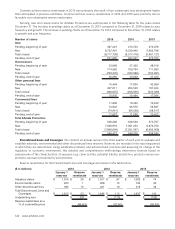
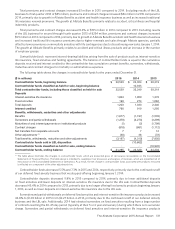
The table below summarizes reserves and claim activity for asbestos and environmental claims before (Gross) and
after (Net) the effects of reinsurance for the past three years.
($ in millions, except ratios) 2015 2014 2013
Gross Net Gross Net Gross Net
Asbestos claims
Beginning reserves $ 1,492 $ 1,014 $ 1,495 $ 1,017 $ 1,522 $ 1,026
Incurred claims and claims expense 51 39 124 87 84 74
Claims and claims expense paid (125) (93) (127) (90) (111) (83)
Ending reserves $ 1,418 $ 960 $ 1,492 $ 1,014 $ 1,495 $ 1,017
Annual survival ratio 11.3 10.3 11.7 11.3 13.5 12.3
3‑year survival ratio 11.7 10.8 12.5 12.1 14.2 14.5
Environmental claims
Beginning reserves $ 267 $ 203 $ 268 $ 208 $ 241 $ 193
Incurred claims and claims expense (13) 1 22 15 44 30
Claims and claims expense paid (32) (25) (23) (20) (17) (15)
Ending reserves $ 222 $ 179 $ 267 $ 203 $ 268 $ 208
Annual survival ratio 6.9 7.2 11.6 10.2 15.8 13.9
3‑year survival ratio 9.3 9.0 14.1 12.7 14.9 13.9
Combined environmental and
asbestos claims
Annual survival ratio 10.4 9.7 11.7 11.1 13.8 12.5
3‑year survival ratio 11.3 10.4 12.7 12.2 14.3 14.4
Percentage of IBNR in ending reserves 56.9% 56.9% 55.4%
The survival ratio is calculated by taking our ending reserves divided by payments made during the year. This is
a commonly used but extremely simplistic and imprecise approach to measuring the adequacy of asbestos and
environmental reserve levels. Many factors, such as mix of business, level of coverage provided and settlement
procedures have significant impacts on the amount of environmental and asbestos claims and claims expense reserves,
claim payments and the resultant ratio. As payments result in corresponding reserve reductions, survival ratios can be
expected to vary over time.
In 2015 and 2014, the asbestos and environmental net 3-year survival ratio decreased due to increased claim payments.
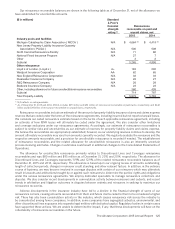
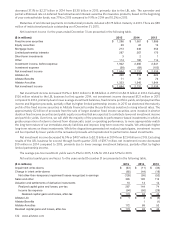
Our net asbestos reserves by type of exposure and total reserve additions are shown in the following table.
($ in millions) December 31, 2015 December 31, 2014 December 31, 2013
Active
policy-
holders
Net
reserves
% of
reserves
Active
policy-
holders
Net
reserves
% of
reserves
Active
policy-
holders
Net
reserves
% of
reserves
Direct policyholders:
Primary 48 $ 10 1% 44 $ 8 1% 53 $ 7 1%
Excess 298 248 26 296 265 26 301 267 26
Total 346 258 27 340 273 27 354 274 27
Assumed reinsurance 156 16 166 16 171 17
IBNR 546 57 575 57 572 56
Total net reserves $ 960 100% $ 1,014 100% $ 1,017 100%
Total reserve additions $ 39 $ 87 $ 74