Allstate 2015 Annual Report Download - page 227
Download and view the complete annual report
Please find page 227 of the 2015 Allstate annual report below. You can navigate through the pages in the report by either clicking on the pages listed below, or by using the keyword search tool below to find specific information within the annual report.-
 1
1 -
2
-
3
-
4
-
5
-
6
-
7
-
8
-
9
-
10
-
11
-
12
-
13
-
14
-
15
-
16
-
17
-
18
-
19
-
20
-
21
-
22
-
23
-
24
-
25
-
26
-
27
-
28
-
29
-
30
-
31
-
32
-
33
-
34
-
35
-
36
-
37
-
38
-
39
-
40
-
41
-
42
-
43
-
44
-
45
-
46
-
47
-
48
-
49
-
50
-
51
-
52
-
53
-
54
-
55
-
56
-
57
-
58
-
59
-
60
-
61
-
62
-
63
-
64
-
65
-
66
-
67
-
68
-
69
-
70
-
71
-
72
-
73
-
74
-
75
-
76
-
77
-
78
-
79
-
80
-
81
-
82
-
83
-
84
-
85
-
86
-
87
-
88
-
89
-
90
-
91
-
92
-
93
-
94
-
95
-
96
-
97
-
98
-
99
-
100
-
101
-
102
-
103
-
104
-
105
-
106
-
107
-
108
-
109
-
110
-
111
-
112
-
113
-
114
-
115
-
116
-
117
-
118
-
119
-
120
-
121
-
122
-
123
-
124
-
125
-
126
-
127
-
128
-
129
-
130
-
131
-
132
-
133
-
134
-
135
-
136
-
137
-
138
-
139
-
140
-
141
-
142
-
143
-
144
-
145
-
146
-
147
-
148
-
149
-
150
-
151
-
152
-
153
-
154
-
155
-
156
-
157
-
158
-
159
-
160
-
161
-
162
-
163
-
164
-
165
-
166
-
167
-
168
-
169
-
170
-
171
-
172
-
173
-
174
-
175
-
176
-
177
-
178
-
179
-
180
-
181
-
182
-
183
-
184
-
185
-
186
-
187
-
188
-
189
-
190
-
191
-
192
-
193
-
194
-
195
-
196
-
197
-
198
-
199
-
200
-
201
-
202
-
203
-
204
-
205
-
206
-
207
-
208
-
209
-
210
-
211
-
212
-
213
-
214
-
215
-
216
-
 217
217 -
 218
218 -
 219
219 -
 220
220 -
 221
221 -
 222
222 -
 223
223 -
 224
224 -
 225
225 -
 226
226 -
 227
227 -
 228
228 -
 229
229 -
 230
230 -
 231
231 -
 232
232 -
 233
233 -
 234
234 -
 235
235 -
 236
236 -
 237
237 -
238
-
239
-
240
-
241
-
242
-
243
-
244
-
245
-
246
-
247
-
248
-
249
-
250
-
251
-
252
-
253
-
254
-
255
-
256
-
257
-
258
-
259
-
260
-
261
-
262
-
263
-
264
-
265
-
266
-
267
-
268
-
269
-
270
-
271
-
272
 |
 |

The Allstate Corporation 2015 Annual Report 221
Because reserves are estimates of unpaid portions of losses that have occurred, including incurred but not reported
(“IBNR”) losses, the establishment of appropriate reserves, including reserves for catastrophes, is an inherently uncertain
and complex process. The ultimate cost of losses may vary materially from recorded amounts, which are based on
management’s best estimates. The highest degree of uncertainty is associated with reserves for losses incurred in the
current reporting period as it contains the greatest proportion of losses that have not been reported or settled. The
Company regularly updates its reserve estimates as new information becomes available and as events unfold that may
affect the resolution of unsettled claims. Changes in prior year reserve estimates, which may be material, are reported in
property-liability insurance claims and claims expense in the Consolidated Statements of Operations in the period such
changes are determined.
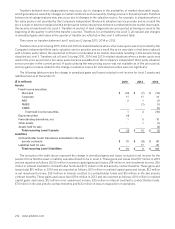
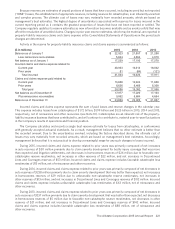
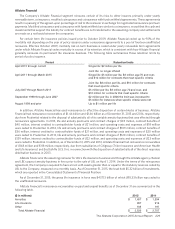
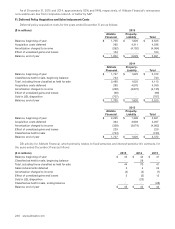
Activity in the reserve for property-liability insurance claims and claims expense is summarized as follows:
($ in millions) 2015 2014 2013
Balance as of January 1 $ 22,923 $ 21,857 $ 21,288
Less reinsurance recoverables 5,694 4,664 4,010
Net balance as of January 1 17,229 17,193 17,278
Incurred claims and claims expense related to:
Current year 20,953 19,512 18,032
Prior years 81 (84) (121)
Total incurred 21,034 19,428 17,911
Claims and claims expense paid related to:
Current year 13,660 12,924 11,658
Prior years 6,626 6,468 6,338
Total paid 20,286 19,392 17,996
Net balance as of December 31 17,977 17,229 17,193
Plus reinsurance recoverables 5,892 5,694 4,664
Balance as of December 31 $ 23,869 $ 22,923 $ 21,857
Incurred claims and claims expense represents the sum of paid losses and reserve changes in the calendar year.
This expense includes losses from catastrophes of $1.72 billion, $1.99 billion and $1.25 billion in 2015, 2014 and 2013,
respectively, net of reinsurance and other recoveries (see Note10). Catastrophes are an inherent risk of the property-
liability insurance business that have contributed to, and will continue to contribute to, material year-to-year fluctuations
in the Company’s results of operations and financial position.
The Company calculates and records a single best reserve estimate for losses from catastrophes, in conformance
with generally accepted actuarial standards. As a result, management believes that no other estimate is better than
the recorded amount. Due to the uncertainties involved, including the factors described above, the ultimate cost of
losses may vary materially from recorded amounts, which are based on management’s best estimates. Accordingly,
management believes that it is not practical to develop a meaningful range for any such changes in losses incurred.
During 2015, incurred claims and claims expense related to prior years was primarily composed of net increases
in auto reserves of $30 million primarily due to claim severity development for bodily injury coverage that was more
than expected and litigation settlements, net decreases in homeowners reserves of $24 million due to favorable non-
catastrophe reserve reestimates, net increases in other reserves of $22 million, and net increases in Discontinued
Lines and Coverages reserves of $53 million. Incurred claims and claims expense includes favorable catastrophe loss
reestimates of $15 million, net of reinsurance and other recoveries.
During 2014, incurred claims and claims expense related to prior years was primarily composed of net decreases in
auto reserves of $238 million primarily due to claim severity development that was better than expected, net increases
in homeowners reserves of $29 million due to unfavorable non-catastrophe reserve reestimates, net increases in
other reserves of $13 million, and net increases in Discontinued Lines and Coverages reserves of $112 million. Incurred
claims and claims expense includes unfavorable catastrophe loss reestimates of $43 million, net of reinsurance and
other recoveries.
During 2013, incurred claims and claims expense related to prior years was primarily composed of net decreases in
auto reserves of $237 million primarily due to claim severity development that was better than expected, net decreases
in homeowners reserves of $5 million due to favorable non-catastrophe reserve reestimates, net decreases in other
reserves of $21 million, and net increases in Discontinued Lines and Coverages reserves of $142 million. Incurred
claims and claims expense includes favorable catastrophe loss reestimates of $88 million, net of reinsurance and
other recoveries.