Allstate 2015 Annual Report Download - page 207
Download and view the complete annual report
Please find page 207 of the 2015 Allstate annual report below. You can navigate through the pages in the report by either clicking on the pages listed below, or by using the keyword search tool below to find specific information within the annual report.-
 1
1 -
2
-
3
-
4
-
5
-
6
-
7
-
8
-
9
-
10
-
11
-
12
-
13
-
14
-
15
-
16
-
17
-
18
-
19
-
20
-
21
-
22
-
23
-
24
-
25
-
26
-
27
-
28
-
29
-
30
-
31
-
32
-
33
-
34
-
35
-
36
-
37
-
38
-
39
-
40
-
41
-
42
-
43
-
44
-
45
-
46
-
47
-
48
-
49
-
50
-
51
-
52
-
53
-
54
-
55
-
56
-
57
-
58
-
59
-
60
-
61
-
62
-
63
-
64
-
65
-
66
-
67
-
68
-
69
-
70
-
71
-
72
-
73
-
74
-
75
-
76
-
77
-
78
-
79
-
80
-
81
-
82
-
83
-
84
-
85
-
86
-
87
-
88
-
89
-
90
-
91
-
92
-
93
-
94
-
95
-
96
-
97
-
98
-
99
-
100
-
101
-
102
-
103
-
104
-
105
-
106
-
107
-
108
-
109
-
110
-
111
-
112
-
113
-
114
-
115
-
116
-
117
-
118
-
119
-
120
-
121
-
122
-
123
-
124
-
125
-
126
-
127
-
128
-
129
-
130
-
131
-
132
-
133
-
134
-
135
-
136
-
137
-
138
-
139
-
140
-
141
-
142
-
143
-
144
-
145
-
146
-
147
-
148
-
149
-
150
-
151
-
152
-
153
-
154
-
155
-
156
-
157
-
158
-
159
-
160
-
161
-
162
-
163
-
164
-
165
-
166
-
167
-
168
-
169
-
170
-
171
-
172
-
173
-
174
-
175
-
176
-
177
-
178
-
179
-
180
-
181
-
182
-
183
-
184
-
185
-
186
-
187
-
188
-
189
-
190
-
191
-
192
-
193
-
194
-
195
-
196
-
 197
197 -
 198
198 -
 199
199 -
 200
200 -
 201
201 -
 202
202 -
 203
203 -
 204
204 -
 205
205 -
 206
206 -
 207
207 -
 208
208 -
 209
209 -
 210
210 -
 211
211 -
 212
212 -
 213
213 -
 214
214 -
 215
215 -
 216
216 -
 217
217 -
218
-
219
-
220
-
221
-
222
-
223
-
224
-
225
-
226
-
227
-
228
-
229
-
230
-
231
-
232
-
233
-
234
-
235
-
236
-
237
-
238
-
239
-
240
-
241
-
242
-
243
-
244
-
245
-
246
-
247
-
248
-
249
-
250
-
251
-
252
-
253
-
254
-
255
-
256
-
257
-
258
-
259
-
260
-
261
-
262
-
263
-
264
-
265
-
266
-
267
-
268
-
269
-
270
-
271
-
272
 |
 |

The Allstate Corporation 2015 Annual Report 201
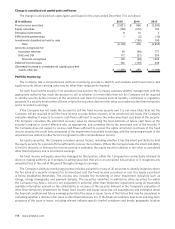
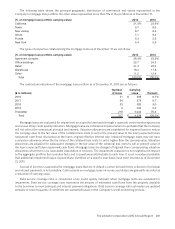
The following table shows the principal geographic distribution of commercial real estate represented in the
Company’s mortgage loan portfolio. No other state represented more than 5% of the portfolio as of December 31.
(% of mortgage loan portfolio carrying value) 2015 2014
California 21.3% 23.9%
Texas 9.7 8.0
New Jersey 8.7 8.0
Illinois 7.1 9.4
Florida 5.3 5.0
New York 4.4 5.9
The types of properties collateralizing the mortgage loans as of December 31 are as follows:
(% of mortgage loan portfolio carrying value) 2015 2014
Apartment complex 26.4% 23.3%
Office buildings 22.7 24.3
Retail 21.3 22.2
Warehouse 18.4 17.8
Other 11.2 12.4
Total 100.0% 100.0%
The contractual maturities of the mortgage loan portfolio as of December 31, 2015 are as follows:
($ in millions)
Number
of loans
Carrying
value Percent
2016 31 $ 289 6.7%
2017 34 379 8.7
2018 33 392 9.0
2019 9 234 5.4
Thereafter 210 3,044 70.2
Total 317 $ 4,338 100.0%
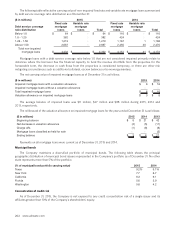
Mortgage loans are evaluated for impairment on a specific loan basis through a quarterly credit monitoring process
and review of key credit quality indicators. Mortgage loans are considered impaired when it is probable that the Company
will not collect the contractual principal and interest. Valuation allowances are established for impaired loans to reduce
the carrying value to the fair value of the collateral less costs to sell or the present value of the loan’s expected future
repayment cash flows discounted at the loan’s original effective interest rate. Impaired mortgage loans may not have
a valuation allowance when the fair value of the collateral less costs to sell is higher than the carrying value. Valuation
allowances are adjusted for subsequent changes in the fair value of the collateral less costs to sell or present value of
the loan’s expected future repayment cash flows. Mortgage loans are charged off against their corresponding valuation
allowances when there is no reasonable expectation of recovery. The impairment evaluation is non-statistical in respect
to the aggregate portfolio but considers facts and circumstances attributable to each loan. It is not considered probable
that additional impairment losses, beyond those identified on a specific loan basis, have been incurred as of December
31, 2015.
Accrual of income is suspended for mortgage loans that are in default or when full and timely collection of principal
and interest payments is not probable. Cash receipts on mortgage loans on nonaccrual status are generally recorded as
a reduction of carrying value.
Debt service coverage ratio is considered a key credit quality indicator when mortgage loans are evaluated for
impairment. Debt service coverage ratio represents the amount of estimated cash flows from the property available
to the borrower to meet principal and interest payment obligations. Debt service coverage ratio estimates are updated
annually or more frequently if conditions are warranted based on the Company’s credit monitoring process.