Allstate 2015 Annual Report Download - page 114
Download and view the complete annual report
Please find page 114 of the 2015 Allstate annual report below. You can navigate through the pages in the report by either clicking on the pages listed below, or by using the keyword search tool below to find specific information within the annual report.-
 1
1 -
2
-
3
-
4
-
5
-
6
-
7
-
8
-
9
-
10
-
11
-
12
-
13
-
14
-
15
-
16
-
17
-
18
-
19
-
20
-
21
-
22
-
23
-
24
-
25
-
26
-
27
-
28
-
29
-
30
-
31
-
32
-
33
-
34
-
35
-
36
-
37
-
38
-
39
-
40
-
41
-
42
-
43
-
44
-
45
-
46
-
47
-
48
-
49
-
50
-
51
-
52
-
53
-
54
-
55
-
56
-
57
-
58
-
59
-
60
-
61
-
62
-
63
-
64
-
65
-
66
-
67
-
68
-
69
-
70
-
71
-
72
-
73
-
74
-
75
-
76
-
77
-
78
-
79
-
80
-
81
-
82
-
83
-
84
-
85
-
86
-
87
-
88
-
89
-
90
-
91
-
92
-
93
-
94
-
95
-
96
-
97
-
98
-
99
-
100
-
101
-
102
-
103
-
 104
104 -
 105
105 -
 106
106 -
 107
107 -
 108
108 -
 109
109 -
 110
110 -
 111
111 -
 112
112 -
 113
113 -
 114
114 -
 115
115 -
 116
116 -
 117
117 -
 118
118 -
 119
119 -
 120
120 -
 121
121 -
 122
122 -
 123
123 -
 124
124 -
125
-
126
-
127
-
128
-
129
-
130
-
131
-
132
-
133
-
134
-
135
-
136
-
137
-
138
-
139
-
140
-
141
-
142
-
143
-
144
-
145
-
146
-
147
-
148
-
149
-
150
-
151
-
152
-
153
-
154
-
155
-
156
-
157
-
158
-
159
-
160
-
161
-
162
-
163
-
164
-
165
-
166
-
167
-
168
-
169
-
170
-
171
-
172
-
173
-
174
-
175
-
176
-
177
-
178
-
179
-
180
-
181
-
182
-
183
-
184
-
185
-
186
-
187
-
188
-
189
-
190
-
191
-
192
-
193
-
194
-
195
-
196
-
197
-
198
-
199
-
200
-
201
-
202
-
203
-
204
-
205
-
206
-
207
-
208
-
209
-
210
-
211
-
212
-
213
-
214
-
215
-
216
-
217
-
218
-
219
-
220
-
221
-
222
-
223
-
224
-
225
-
226
-
227
-
228
-
229
-
230
-
231
-
232
-
233
-
234
-
235
-
236
-
237
-
238
-
239
-
240
-
241
-
242
-
243
-
244
-
245
-
246
-
247
-
248
-
249
-
250
-
251
-
252
-
253
-
254
-
255
-
256
-
257
-
258
-
259
-
260
-
261
-
262
-
263
-
264
-
265
-
266
-
267
-
268
-
269
-
270
-
271
-
272
 |
 |

108 www.allstate.com
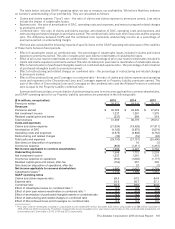
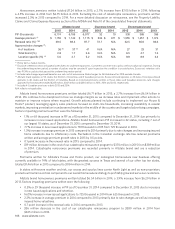
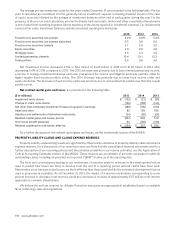
Homeowners premiums written totaled $7.24 billion in 2015, a 2.7% increase from $7.05 billion in 2014, following
a 4.5% increase in 2014 from $6.75 billion in 2013. Excluding the cost of catastrophe reinsurance, premiums written
increased 2.3% in 2015 compared to 2014. For a more detailed discussion on reinsurance, see the Property-Liability
Claims and Claims Expense Reserves section of the MD&A and Note10 of the consolidated financial statements.
Allstate brand Esurance brand Encompass brand
2015 2014 2013 2015 2014 2015 2014 2013
PIF (thousands) 6,174 6,106 6,077 32 10 338 365 356
Average premium (1) $ 1,155 $ 1,140 $ 1,115 $ 833 $ 811 $ 1,555 $ 1,457 $ 1,374
Renewal ratio (%) (1)(2) 88.5 88.4 87.7 72.7 N/A 82.5 85.6 86.6
Approved rate changes (3):
# of locations 36 (5) 37 (5) 41 N/A N/A 27 23 31
Total brand (%) 2.8 1.7 3.6 N/A N/A 6.5 4.7 7.4
Location specific (%) (4) 5.0 4.7 5.2 N/A N/A 8.8 8.9 8.2
(1) Policy term is twelve months.
(2) Esurance’s retention ratios will appear lower due to its underwriting process. Customers can enter into a policy without a physical inspection. During
the underwriting review period, a number of polices may be canceled if upon inspection the condition is unsatisfactory. Esurance’s retention ratio
was 91.9% on policies that passed the underwriting review period.
(3) Includes rate changes approved based on our net cost of reinsurance. Rate changes for Allstate brand for 2013 exclude Canada.
(4) Allstate brand operates in 50 states, the District of Columbia, and 5 Canadian provinces. Esurance brand operates in 25 states. Encompass brand
operates in 40 states and the District of Columbia. Based on historical premiums written in those states and Canadian provinces, rate changes
approved for homeowners totaled $225 million, $147million and $254million in 2015, 2014 and 2013, respectively.
(5) Includes 4 Canadian provinces in both 2015 and 2014.
N/A reflects not applicable.
Allstate brand homeowners premiums written totaled $6.71 billion in 2015, a 2.7% increase from $6.54 billion in
2014. We continue to be disciplined in how we manage margins as we increase rates and implement other actions to
maintain or improve returns where required. Growth actions planned include continuing to implement our House &
Home® product, leveraging agency sales practices focused on multi-line households, increasing availability in coastal
markets, improving penetration in underserved markets in the middle of the country and targeted advertising campaigns.
Factors impacting premiums written were the following:
• 1.1% or 68 thousand increase in PIF as of December31, 2015 compared to December31, 2014 due primarily to
increases in new issued applications. Allstate brand homeowners PIF increased in 32 states, including 7 out of
our largest 10 states, as of December 31, 2015 compared to December 31, 2014.
• 7.7% increase in new issued applications to 781thousand in 2015 from 725thousand in 2014.
• 1.3% increase in average premium in 2015 compared to 2014 primarily due to rate changes and increasing insured
home valuations due to inflationary costs. Fluctuation in the Canadian exchange rate has reduced premiums
written and average premium growth rates in 2015 by 0.5 points.
• 0.1 point increase in the renewal ratio in 2015 compared to 2014.
• $19million decrease in the cost of our catastrophe reinsurance program to $370million in 2015 from $389million
in 2014. Catastrophe reinsurance premiums are recorded primarily in Allstate brand and are a reduction
of premium.
Premiums written for Allstate’s House and Home product, our redesigned homeowners new business offering
currently available in 74% of total states, with the greatest success in Texas and several of our other top ten states,
totaled $1.46 billion in 2015 compared to $934million in 2014.
In states with severe weather and risk, our excess and surplus lines carrier North Light as well as non-proprietary
products will remain a critical component to our overall homeowners strategy to profitably grow and serve our customers.
Allstate brand homeowners premiums written totaled $6.54 billion in 2014, a 3.9% increase from $6.29 billion in
2013. Factors impacting premiums written were the following:
• 0.5% or 29 thousand increase in PIF as of December 31, 2014 compared to December 31, 2013 due to increases
in new issued applications and retention.
• 16.0% increase in new issued applications to 725 thousand in 2014 from 625 thousand in 2013.
• 2.2% increase in average premium in 2014 compared to 2013 primarily due to rate changes as well as increasing
insured home valuations.
• 0.7 point increase in the renewal ratio in 2014 compared to 2013.
• $36 million decrease in the cost of our catastrophe reinsurance program to $389 million in 2014 from
$425 million in 2013.