Advance Auto Parts 2008 Annual Report Download - page 96
Download and view the complete annual report
Please find page 96 of the 2008 Advance Auto Parts annual report below. You can navigate through the pages in the report by either clicking on the pages listed below, or by using the keyword search tool below to find specific information within the annual report.-
 1
1 -
2
-
3
-
4
-
5
-
6
-
7
-
8
-
9
-
10
-
11
-
12
-
13
-
14
-
15
-
16
-
17
-
18
-
19
-
20
-
21
-
22
-
23
-
24
-
25
-
26
-
27
-
28
-
29
-
30
-
31
-
32
-
33
-
34
-
35
-
36
-
37
-
38
-
39
-
40
-
41
-
42
-
43
-
44
-
45
-
46
-
47
-
48
-
49
-
50
-
51
-
52
-
53
-
54
-
55
-
56
-
57
-
58
-
59
-
60
-
61
-
62
-
63
-
64
-
65
-
66
-
67
-
68
-
69
-
70
-
71
-
72
-
73
-
74
-
75
-
76
-
77
-
78
-
79
-
80
-
81
-
82
-
83
-
84
-
85
-
 86
86 -
 87
87 -
 88
88 -
 89
89 -
 90
90 -
 91
91 -
 92
92 -
 93
93 -
 94
94 -
 95
95 -
 96
96 -
 97
97 -
 98
98 -
 99
99 -
 100
100 -
 101
101 -
 102
102 -
 103
103 -
 104
104 -
 105
105 -
 106
106
 |
 |

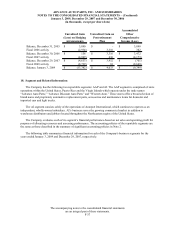
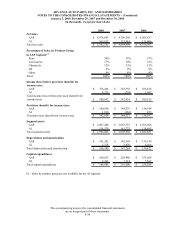
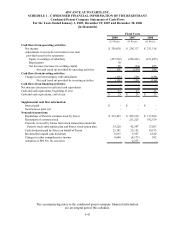
ADVANCE AUTO PARTS, INC.
SCHEDULE I – CONDENSED FINANCIAL INFORMATION OF THE REGISTRANT
Condensed Parent Company Statements of Operations
For the Years Ended January 3, 2009, December 29, 2007 and December 30, 2006
(in thousands, except per share data)
The accompanying notes to the condensed parent company financial information
are an integral part of this schedule.
F-42
2008 2007 2006
(53 Weeks) (52 Weeks) (52 Weeks)
Selling, general and administrative expenses 23,761$ 166$ 165$
Other income, net 24,551 - -
Income (loss) before provision (benefit) for income taxes 790 (166) (165)
Income tax provision (benefit) 714 (60) (58)
Income (loss) before equity in earnings of subsidiaries 76 (106) (107)
Equity in earnings of subsidiaries 237,962 238,423 231,425
Net income 238,038$ 238,317$ 231,318$
Net income per basic share 2.51$ 2.30$ 2.18$
Net income per diluted share 2.50$ 2.28$ 2.16$
Average common shares outstanding 94,655 103,826 106,129
Dilutive effect of share-based compensation 650 828 995
Average common shares outstanding - assuming dilution 95,305 104,654 107,124
Fiscal Years