Advance Auto Parts 2008 Annual Report Download - page 33
Download and view the complete annual report
Please find page 33 of the 2008 Advance Auto Parts annual report below. You can navigate through the pages in the report by either clicking on the pages listed below, or by using the keyword search tool below to find specific information within the annual report.-
 1
1 -
2
-
3
-
4
-
5
-
6
-
7
-
8
-
9
-
10
-
11
-
12
-
13
-
14
-
15
-
16
-
17
-
18
-
19
-
20
-
21
-
22
-
 23
23 -
 24
24 -
 25
25 -
 26
26 -
 27
27 -
 28
28 -
 29
29 -
 30
30 -
 31
31 -
 32
32 -
 33
33 -
 34
34 -
 35
35 -
 36
36 -
 37
37 -
 38
38 -
 39
39 -
 40
40 -
 41
41 -
 42
42 -
 43
43 -
44
-
45
-
46
-
47
-
48
-
49
-
50
-
51
-
52
-
53
-
54
-
55
-
56
-
57
-
58
-
59
-
60
-
61
-
62
-
63
-
64
-
65
-
66
-
67
-
68
-
69
-
70
-
71
-
72
-
73
-
74
-
75
-
76
-
77
-
78
-
79
-
80
-
81
-
82
-
83
-
84
-
85
-
86
-
87
-
88
-
89
-
90
-
91
-
92
-
93
-
94
-
95
-
96
-
97
-
98
-
99
-
100
-
101
-
102
-
103
-
104
-
105
-
106
 |
 |

19
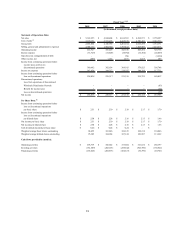
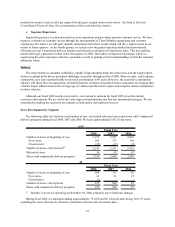
2008 2007 2006 2005 2004
Balance Sheet and Other Financial Data:
Cash and cash equivalents 37,358$ 14,654$ 11,128$ 40,783$ 56,321$
Inventory 1,623,088$ 1,529,469$ 1,463,340$ 1,367,099$ 1,201,450$
Inventory turnover
(5)
1.70 1.69 1.71 1.75 1.74
Inventory per store
(6)
482$ 469$ 475$ 476$ 453$
Accounts payable to inventory ratio
(7)
57.2% 55.1% 53.2% 54.8% 53.7%
Net working capital
(8)
442,632$ 456,897$ 498,553$ 406,476$ 416,302$
Capital expenditures 184,986$ 210,600$ 258,586$ 216,214$ 179,766$
Total assets 2,964,065$ 2,805,566$ 2,682,681$ 2,542,149$ 2,201,962$
Total debt 456,164$ 505,672$ 477,240$ 438,800$ 470,000$
Total net debt
(9)
439,394$ 521,018$ 500,318$ 448,187$ 433,863$
Total stockholders' equity 1,075,166$ 1,023,795$ 1,030,854$ 919,771$ 722,315$
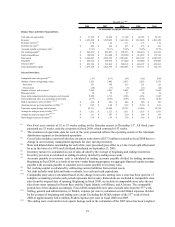
Selected Store Data:
Comparable store sales growth
(10)
1.5% 0.7% 1.6% 8.2% 6.0%
Number of stores at beginning of year 3,261 3,082 2,872 2,652 2,539
New stores 127 196 215 231 125
Closed stores (20) (17) (5) (11) (12)
Number of stores, end of period 3,368 3,261 3,082 2,872 2,652
Relocated stores 10 29 47 54 34
Stores with commercial delivery program, end of period 2,880 2,712 2,526 2,254 1,945
Total commercial sales, as a percentage of total sales 29.5% 26.6% 25.0% 21.8% 18.4%
SG&A expenses per store (in 000s)
(
11
)(
12
)
618$ 601$ 604$ 586$ 549$
Operating income per team member (in 000s)
(
13
)
9.02$ 9.40$ 9.29$ 10.30$ 9.01$
Total store square footage, end of period 24,711 23,982 22,753 21,246 19,734
Average net sales per store (in 000s)
(12)(14)
1,551$ 1,527$ 1,551$ 1,555$ 1,453$
Average net sales per square foot
(12)(15)
211$ 207$ 210$ 209$ 195$
Gross margin return on inventory
(16)
3.56$ 3.39$ 3.38$ 3.43$ 3.18$
Fiscal Year
(1)(2)
(in thousands, except per share data and ratios)
(1) Our fiscal year consists of 52 or 53 weeks ending on the Saturday nearest to December 31st. All fiscal years
presented are 52 weeks, with the exception of fiscal 2008, which consisted of 53 weeks.
(2) The statement of operations data for each of the years presented reflects the operating results of the wholesale
distribution segment as discontinued operations.
(3) Cost of sales includes a non-cash obsolete inventory write-down of $37.5 million recorded in fiscal 2008 due to a
change in our inventory management approach for slow moving inventory.
(4) Basic and diluted shares outstanding for each of the years presented gives effect to a 3-for-2 stock split effectuated
by us in the form of a 50% stock dividend distributed on September 23, 2005.
(5) Inventory turnover is calculated as cost of sales divided by the average of beginning and ending inventories.
(6) Inventory per store is calculated as ending inventory divided by ending store count.
(7) Accounts payable to inventory ratio is calculated as ending accounts payable divided by ending inventory.
Beginning in fiscal 2004, as a result of our new vendor financing program, we aggregate financed vendor accounts
payable with accounts payable to calculate our accounts payable to inventory ratio.
(8) Net working capital is calculated by subtracting current liabilities from current assets.
(9) Net debt includes total debt and bank overdrafts, less cash and cash equivalents.
(10) Comparable store sales is calculated based on the change in net sales starting once a store has been open for 13
complete accounting periods (each period represents four weeks). Relocations are included in comparable store
sales from the original date of opening. Beginning in fiscal 2008, we include in comparable store sales the net
sales from stores operated in Puerto Rico and the Virgin Islands, or Offshore, and AI stores. The comparable
periods have been adjusted accordingly. Fiscal 2008 comparable store sales exclude sales from the 53rd week.
(11) Selling, general and administrative, or SG&A, expense per store is calculated as total SG&A expenses divided
by the average of beginning and ending store count. Excluding the SG&A impact of the 53rd week of fiscal
2008 of approximately $28.4 million, SG&A expenses per store in fiscal 2008 was $609.
(12) The ending store count and/or store square footage used in the calculation of the 2005 ratios has been weighted