Advance Auto Parts 2008 Annual Report Download - page 46
Download and view the complete annual report
Please find page 46 of the 2008 Advance Auto Parts annual report below. You can navigate through the pages in the report by either clicking on the pages listed below, or by using the keyword search tool below to find specific information within the annual report.-
 1
1 -
2
-
3
-
4
-
5
-
6
-
7
-
8
-
9
-
10
-
11
-
12
-
13
-
14
-
15
-
16
-
17
-
18
-
19
-
20
-
21
-
22
-
23
-
24
-
25
-
26
-
27
-
28
-
29
-
30
-
31
-
32
-
33
-
34
-
35
-
 36
36 -
 37
37 -
 38
38 -
 39
39 -
 40
40 -
 41
41 -
 42
42 -
 43
43 -
 44
44 -
 45
45 -
 46
46 -
 47
47 -
 48
48 -
 49
49 -
 50
50 -
 51
51 -
 52
52 -
 53
53 -
 54
54 -
 55
55 -
 56
56 -
57
-
58
-
59
-
60
-
61
-
62
-
63
-
64
-
65
-
66
-
67
-
68
-
69
-
70
-
71
-
72
-
73
-
74
-
75
-
76
-
77
-
78
-
79
-
80
-
81
-
82
-
83
-
84
-
85
-
86
-
87
-
88
-
89
-
90
-
91
-
92
-
93
-
94
-
95
-
96
-
97
-
98
-
99
-
100
-
101
-
102
-
103
-
104
-
105
-
106
 |
 |

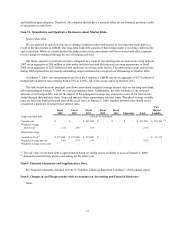
32
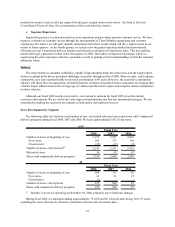
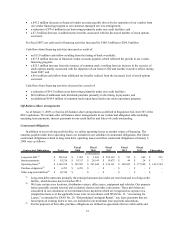
2008 2007 2006
Cash flows from operating activities 478.7$ 410.5$ 333.6$
Cash flows from investing activities (181.6) (202.1) (258.6)
Cash flows from financing activities (274.4) (204.9) (104.6)
Net increase (decrease) in cash and
cash equivalents 22.7$ 3.5$ (29.6)$
Fiscal Year
(in millions)
Operating Activities
For fiscal 2008, net cash provided by operating activities increased $68.2 million to $478.7 million. This net
increase in operating cash was driven primarily by:
• $23.4 million increase in earnings exclusive of a $23.6 million non-cash obsolete inventory write-down
(net of tax) as a result of our favorable operating income during fiscal 2008 (inclusive of the approximate
$9.6 million impact of the 53rd week); and
• a $29.5 million increase in cash flows resulting from the timing of the payment of accrued operating
expenses.
For fiscal 2007, net cash provided by operating activities increased $76.9 million to $410.5 million. Net income
increased by $7.0 million during fiscal 2007. Significant changes in fiscal 2007 working capital resulted in the
following sources of cash:
• a $41.2 million increase in cash flows from inventory, net of accounts payable, reflective of our slow down
of inventory growth in line with our current sales trend, while maintaining adequate levels of inventory to
support our parts availability initiative; and
• a $35.7 million increase in cash flows comprised of other movements in working capital, including the
timing in payment of certain operating expenses.
Investing Activities
For fiscal 2008, net cash used in investing activities decreased by $20.5 million to $181.6 million. The decrease
in cash used was primarily due to:
• a $25.6 million decrease in capital expenditures reflective of a reduction in store development; and
• the absence of $6.6 million in insurance proceeds, received in fiscal 2007.
For fiscal 2007, net cash used in investing activities decreased by $56.5 million to $202.1 million. Significant
components of this decrease consisted of:
• a decrease in capital expenditures of $48.0 million resulting primarily from less spending on capital assets
in our store locations, the impact of the reduced scope in remodels and fewer relocations as compared to
2006; and
• the absence of a $12.5 million business acquisition payment made in fiscal 2006.
Financing Activities
For fiscal 2008, net cash used in financing activities increased by $69.6 million to $274.4 million.
Cash flows from financing activities increased as a result of:
• a $63.5 million decrease in the repurchase of common stock under our stock repurchase program.
Cash flows from financing activities decreased as result of:
• a $5.2 million cash outflow resulting from the timing of bank overdrafts;