Advance Auto Parts 2008 Annual Report Download - page 37
Download and view the complete annual report
Please find page 37 of the 2008 Advance Auto Parts annual report below. You can navigate through the pages in the report by either clicking on the pages listed below, or by using the keyword search tool below to find specific information within the annual report.-
 1
1 -
2
-
3
-
4
-
5
-
6
-
7
-
8
-
9
-
10
-
11
-
12
-
13
-
14
-
15
-
16
-
17
-
18
-
19
-
20
-
21
-
22
-
23
-
24
-
25
-
26
-
 27
27 -
 28
28 -
 29
29 -
 30
30 -
 31
31 -
 32
32 -
 33
33 -
 34
34 -
 35
35 -
 36
36 -
 37
37 -
 38
38 -
 39
39 -
 40
40 -
 41
41 -
 42
42 -
 43
43 -
 44
44 -
 45
45 -
 46
46 -
 47
47 -
48
-
49
-
50
-
51
-
52
-
53
-
54
-
55
-
56
-
57
-
58
-
59
-
60
-
61
-
62
-
63
-
64
-
65
-
66
-
67
-
68
-
69
-
70
-
71
-
72
-
73
-
74
-
75
-
76
-
77
-
78
-
79
-
80
-
81
-
82
-
83
-
84
-
85
-
86
-
87
-
88
-
89
-
90
-
91
-
92
-
93
-
94
-
95
-
96
-
97
-
98
-
99
-
100
-
101
-
102
-
103
-
104
-
105
-
106
 |
 |

23
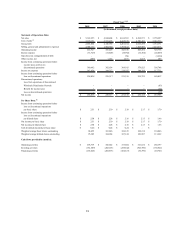
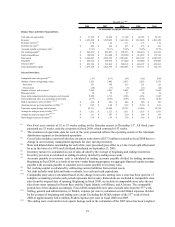
productivity metrics such as sales per square foot and gross margin return on inventory. See Item 6, Selected
Consolidated Financial Data, for a presentation of these and other key metrics.
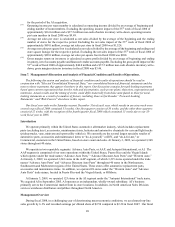
Superior Experience
Superior Experience is centered around our store operations and providing superior customer service. We have
begun to evaluate our customer service through the measurement of Team Member engagement and customer
satisfaction. We believe we will gain valuable information from these results which will drive improvement in our
results in future quarters. In the fourth quarter, we tested a new integrated operating model that demonstrated
efficiencies in our Commercial delivery business and related acceleration in Commercial sales. This new staffing
model will begin a phased-in rollout in the first quarter of 2009. The leaders of Superior Experience will be re-
engineering the store experience and store operations as well as gaining a better understanding of what the customer
ultimately wants.
Industry
The steep decline in consumer confidence, rapidly rising unemployment, the credit crisis and the single largest
decline in annual miles driven presented challenges to retailers throughout fiscal 2008. More recently, retail industry
comparable store sales represented the worst retail environment in 40 years. However, the automotive aftermarket
industry will likely have an opportunity to benefit from the economic downturn because consumers are keeping their
vehicles longer which increases the average age of vehicles and the need to repair and complete routine maintenance
on those vehicles.
Although our fiscal 2008 results were positive, our outlook is cautious for fiscal 2009 given the current
economic environment. We are still in the early stages of implementing our four key turnaround strategies. We are
committed to making the necessary investments to help ensure our long-term success.
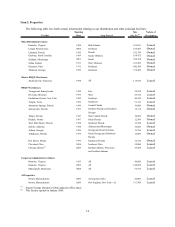
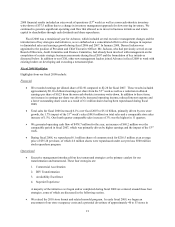
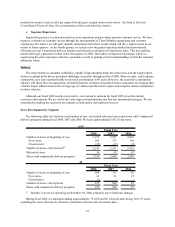
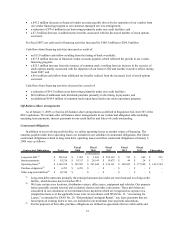
Store Development by Segment
The following table sets forth the total number of new, closed and relocated stores and stores with Commercial
delivery programs during fiscal 2008, 2007 and 2006. We lease approximately 81% of our stores.
2008 2007 2006
Number of stores at beginning of year 3,153 2,995 2,810
New stores 109 175 190
Closed stores (19) (17) (5)
Number of stores, end of period
(a)
3,243 3,153 2,995
Relocated stores 10 29 47
Stores with commercial delivery programs 2,755 2,604 2,439
2008 2007 2006
Number of stores at beginning of year 108 87 62
New stores 18 21 25
Closed stores (1) - -
Number of stores, end of period 125 108 87
Stores with commercial delivery programs 125 108 87
AAP Fiscal Year
AI Fiscal Year
(a) Includes 2 stores not operating at December 30, 2006, primarily due to hurricane damage.
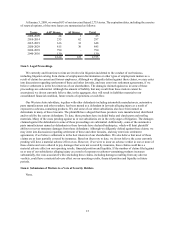
During fiscal 2009, we anticipate adding approximately 75 AAP and 30 AI stores and closing 10 to 15 stores,
excluding the stores that may be closed in connection with our store divestiture plan.