Advance Auto Parts 2008 Annual Report Download - page 34
Download and view the complete annual report
Please find page 34 of the 2008 Advance Auto Parts annual report below. You can navigate through the pages in the report by either clicking on the pages listed below, or by using the keyword search tool below to find specific information within the annual report.-
 1
1 -
2
-
3
-
4
-
5
-
6
-
7
-
8
-
9
-
10
-
11
-
12
-
13
-
14
-
15
-
16
-
17
-
18
-
19
-
20
-
21
-
22
-
23
-
 24
24 -
 25
25 -
 26
26 -
 27
27 -
 28
28 -
 29
29 -
 30
30 -
 31
31 -
 32
32 -
 33
33 -
 34
34 -
 35
35 -
 36
36 -
 37
37 -
 38
38 -
 39
39 -
 40
40 -
 41
41 -
 42
42 -
 43
43 -
 44
44 -
45
-
46
-
47
-
48
-
49
-
50
-
51
-
52
-
53
-
54
-
55
-
56
-
57
-
58
-
59
-
60
-
61
-
62
-
63
-
64
-
65
-
66
-
67
-
68
-
69
-
70
-
71
-
72
-
73
-
74
-
75
-
76
-
77
-
78
-
79
-
80
-
81
-
82
-
83
-
84
-
85
-
86
-
87
-
88
-
89
-
90
-
91
-
92
-
93
-
94
-
95
-
96
-
97
-
98
-
99
-
100
-
101
-
102
-
103
-
104
-
105
-
106
 |
 |
20
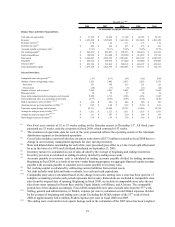
for the period of the AI acquisition.
(13) Operating income per team member is calculated as operating income divided by an average of beginning and
ending number of team members. Excluding the operating income impact of the 53rd week of fiscal 2008 of
approximately $16.0 million and a $37.5 million non-cash obsolete inventory write-down, operating income
per team member in fiscal 2008 was $9.49.
(14) Average net sales per store is calculated as net sales divided by the average of the beginning and the ending
number of stores for the respective period. Excluding the net sales impact of the 53rd week of fiscal 2008 of
approximately $89.0 million, average net sales per store in fiscal 2008 was $1,524.
(15) Average net sales per square foot is calculated as net sales divided by the average of the beginning and ending total
store square footage for the respective period. Excluding the net sales impact of the 53rd week of fiscal 2008 of
approximately $89.0 million, average net sales per square foot in fiscal 2008 was $208.
(16) Gross margin return on inventory is calculated as gross profit divided by an average of beginning and ending
inventory, net of accounts payable and financed vendor accounts payable. Excluding the gross profit impact of the
53rd week of fiscal 2008 of approximately $44.0 million and a $37.5 million non-cash obsolete inventory write-
down, gross margin return on inventory in fiscal 2008 was $3.46.
Item 7. Management's Discussion and Analysis of Financial Condition and Results of Operations.
The following discussion and analysis of financial condition and results of operations should be read in
conjunction with "Selected Consolidated Financial Data," our consolidated historical financial statements and the
notes to those statements that appear elsewhere in this report. Our discussion contains forward-looking statements
based upon current expectations that involve risks and uncertainties, such as our plans, objectives, expectations and
intentions. Actual results and the timing of events could differ materially from those anticipated in these forward-
looking statements as a result of a number of factors, including those set forth under “Forward-Looking
Statements” and "Risk Factors" elsewhere in this report.
Our fiscal year ends on the Saturday nearest December 31st of each year, which results in an extra week every
several years (fiscal 2008 contained 53 weeks). Our first quarter consists of 16 weeks, and the other three quarters
consist of 12 weeks, with the exception of the fourth quarter fiscal 2008 which contained 13 weeks due to our 53-
week fiscal year in 2008.
Introduction
We operate primarily within the United States automotive aftermarket industry, which includes replacement
parts (excluding tires), accessories, maintenance items, batteries and automotive chemicals for cars and light trucks
(pickup trucks, vans, minivans and sport utility vehicles). We currently are the second largest specialty retailer of
automotive parts, accessories and maintenance items to “do-it-yourself,” or DIY, and “do-it-for-me,” or
Commercial, customers in the United States, based on store count and sales. At January 3, 2009, we operated 3,368
stores throughout 40 states.
We operate in two reportable segments: Advance Auto Parts, or AAP, and Autopart International, or AI. The
AAP segment is comprised of our store operations within the United States, Puerto Rico and the Virgin Islands
which operate under the trade names “Advance Auto Parts,” “Advance Discount Auto Parts” and “Western Auto.”
At January 3, 2009, we operated 3,243 stores in the AAP segment, of which 3,215 stores operated under the trade
names “Advance Auto Parts” and “Advance Discount Auto Parts” throughout 40 states in the Northeastern,
Southeastern and Midwestern regions of the United States. These stores offer automotive replacement parts,
accessories and maintenance items. In addition, we operated 28 stores under the “Western Auto” and “Advance
Auto Parts” trade names, located in Puerto Rico and the Virgin Islands, or Offshore.
At January 3, 2009, we operated 125 stores in the AI segment under the “Autopart International” trade name.
We acquired AI in September 2005. AI operates as an independent, wholly-owned subsidiary. AI’s business
primarily serves the Commercial market from its store locations. In addition, its North American Sales Division
services warehouse distributors and jobbers throughout North America.
Management Overview
During fiscal 2008, in a challenging year of deteriorating macroeconomic conditions, we accelerated top-line
sales growth by 6.1% and recorded earnings per diluted share of $2.50 compared to $2.28 in fiscal 2007. Our fiscal