Advance Auto Parts 2008 Annual Report Download - page 30
Download and view the complete annual report
Please find page 30 of the 2008 Advance Auto Parts annual report below. You can navigate through the pages in the report by either clicking on the pages listed below, or by using the keyword search tool below to find specific information within the annual report.-
 1
1 -
2
-
3
-
4
-
5
-
6
-
7
-
8
-
9
-
10
-
11
-
12
-
13
-
14
-
15
-
16
-
17
-
18
-
19
-
 20
20 -
 21
21 -
 22
22 -
 23
23 -
 24
24 -
 25
25 -
 26
26 -
 27
27 -
 28
28 -
 29
29 -
 30
30 -
 31
31 -
 32
32 -
 33
33 -
 34
34 -
 35
35 -
 36
36 -
 37
37 -
 38
38 -
 39
39 -
 40
40 -
41
-
42
-
43
-
44
-
45
-
46
-
47
-
48
-
49
-
50
-
51
-
52
-
53
-
54
-
55
-
56
-
57
-
58
-
59
-
60
-
61
-
62
-
63
-
64
-
65
-
66
-
67
-
68
-
69
-
70
-
71
-
72
-
73
-
74
-
75
-
76
-
77
-
78
-
79
-
80
-
81
-
82
-
83
-
84
-
85
-
86
-
87
-
88
-
89
-
90
-
91
-
92
-
93
-
94
-
95
-
96
-
97
-
98
-
99
-
100
-
101
-
102
-
103
-
104
-
105
-
106
 |
 |

16
PART II
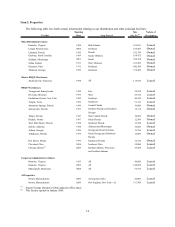
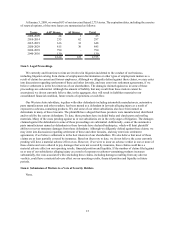
Item 5. Market for Registrant’s Common Equity, Related Stockholder Matters and Issuer Purchases of Equity
Securities.
Our common stock is listed on the New York Stock Exchange, or NYSE, under the symbol "AAP." The table
below sets forth, for the fiscal periods indicated, the high and low sale prices per share for our common stock, as
reported by the NYSE.
High Low
Fiscal Year Ended January 3, 2009
Fourth Quarter 37.37$ 24.17$
Third Quarter 44.61$ 36.75$
Second Quarter 41.74$ 33.57$
First Quarter 37.99$ 31.20$
Fiscal Year Ended December 29, 2007
Fourth Quarter 40.73$ 31.53$
Third Quarter 40.15$ 29.51$
Second Quarter 43.62$ 39.22$
First Quarter 40.80$ 34.90$
The closing price of our common stock on March 2, 2009 was $36.31. At March 2, 2009, there were 384
holders of record of our common stock (which does not include the number of individual beneficial owners whose
shares were held on their behalf by brokerage firms in street name).
On February 15, 2006, our Board of Directors declared a quarterly cash dividend, the first in our history. The
$0.06 per share quarterly cash dividend has been declared in each quarter since its inception in fiscal 2006. Any
payments of dividends in the future will be at the discretion of our Board of Directors and will depend upon our
results of operations, earnings, capital requirements and other factors deemed relevant by our Board of Directors.
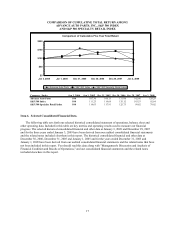
Stock Price Performance
The following graph shows a comparison of our cumulative total return on our common stock, the Standard &
Poor’s 500 Index and the Standard & Poor’s 500 Specialty Retail Index. The graph assumes that the value of an
investment in our common stock and in each such index was $100 on January 3, 2004, and that any dividends have
been reinvested. The comparison in the graph below is based solely on historical data and is not intended to forecast
the possible future performance of our common stock.