Advance Auto Parts 2008 Annual Report Download - page 32
Download and view the complete annual report
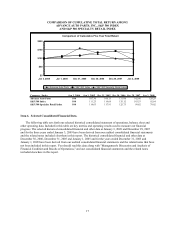
Please find page 32 of the 2008 Advance Auto Parts annual report below. You can navigate through the pages in the report by either clicking on the pages listed below, or by using the keyword search tool below to find specific information within the annual report.-
 1
1 -
2
-
3
-
4
-
5
-
6
-
7
-
8
-
9
-
10
-
11
-
12
-
13
-
14
-
15
-
16
-
17
-
18
-
19
-
20
-
21
-
 22
22 -
 23
23 -
 24
24 -
 25
25 -
 26
26 -
 27
27 -
 28
28 -
 29
29 -
 30
30 -
 31
31 -
 32
32 -
 33
33 -
 34
34 -
 35
35 -
 36
36 -
 37
37 -
 38
38 -
 39
39 -
 40
40 -
 41
41 -
 42
42 -
43
-
44
-
45
-
46
-
47
-
48
-
49
-
50
-
51
-
52
-
53
-
54
-
55
-
56
-
57
-
58
-
59
-
60
-
61
-
62
-
63
-
64
-
65
-
66
-
67
-
68
-
69
-
70
-
71
-
72
-
73
-
74
-
75
-
76
-
77
-
78
-
79
-
80
-
81
-
82
-
83
-
84
-
85
-
86
-
87
-
88
-
89
-
90
-
91
-
92
-
93
-
94
-
95
-
96
-
97
-
98
-
99
-
100
-
101
-
102
-
103
-
104
-
105
-
106
 |
 |

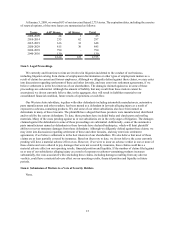
18
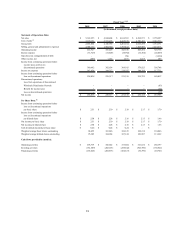
2008 2007 2006 2005 2004
Statement of Operations Data:
Net sales 5,142,255$ 4,844,404$ 4,616,503$ 4,264,971$ 3,770,297$
Cost of sales
(3)
2,679,191 2,523,435 2,415,339 2,250,493 2,016,926
Gross profit 2,463,064 2,320,969 2,201,164 2,014,478 1,753,371
Selling, general and administrative expenses 2,048,137 1,904,540 1,797,814 1,605,986 1,424,613
Operating income 414,927 416,429 403,350 408,492 328,758
Interest expense (33,729) (34,809) (35,992) (32,384) (20,069)
Gain (loss) on extinguishment of debt - - 986
-
(3,230)
Other income, net (506) 1,014 1,571 2,815 289
Income from continuing operations before
income taxes and loss on
discontinued operations 380,692 382,634 369,915 378,923 305,748
Income tax expense 142,654 144,317 138,597 144,198 117,721
Income from continuing operations before
loss on discontinued operations 238,038 238,317 231,318 234,725 188,027
Discontinued operations:
Loss from operations of discontinued
Wholesale Distribution Network
- - - -
(63)
Benefit for income taxes
- - - -
(24)
Loss on discontinued operations
- - - -
(39)
Net income 238,038$ 238,317$ 231,318$ 234,725$ 187,988$
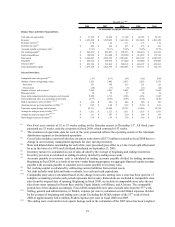
Per Share Data:
(4)
Income from continuing operations before
loss on discontinued operations
per basic share 2.51$ 2.30$ 2.18$ 2.17$ 1.70$
Income from continuing operations before
loss on discontinued operations
per diluted share 2.50$ 2.28$ 2.16$ 2.13$ 1.66$
Net income per basic share 2.51$ 2.30$ 2.18$ 2.17$ 1.70$
Net income per diluted share 2.50$ 2.28$ 2.16$ 2.13$ 1.66$
Cash dividends declared per basic share 0.24$ 0.24$ 0.24$ -$ -$
Weighted average basic shares outstanding 94,655 103,826 106,129 108,318 110,846
Weighted average diluted shares outstanding 95,305 104,654 107,124 109,987 113,222
Cash flows provided by (used in):
Operating activities 478,739$ 410,542$ 333,604$ 321,632$ 260,397$
Investing activities (181,609) (202,143) (258,642) (302,780) (166,822)
Financing activities (274,426) (204,873) (104,617) (34,390) (48,741)
Fiscal Year
(1)(2)
(in thousands, except per share data)