Advance Auto Parts 2008 Annual Report Download - page 42
Download and view the complete annual report
Please find page 42 of the 2008 Advance Auto Parts annual report below. You can navigate through the pages in the report by either clicking on the pages listed below, or by using the keyword search tool below to find specific information within the annual report.-
 1
1 -
2
-
3
-
4
-
5
-
6
-
7
-
8
-
9
-
10
-
11
-
12
-
13
-
14
-
15
-
16
-
17
-
18
-
19
-
20
-
21
-
22
-
23
-
24
-
25
-
26
-
27
-
28
-
29
-
30
-
31
-
 32
32 -
 33
33 -
 34
34 -
 35
35 -
 36
36 -
 37
37 -
 38
38 -
 39
39 -
 40
40 -
 41
41 -
 42
42 -
 43
43 -
 44
44 -
 45
45 -
 46
46 -
 47
47 -
 48
48 -
 49
49 -
 50
50 -
 51
51 -
 52
52 -
53
-
54
-
55
-
56
-
57
-
58
-
59
-
60
-
61
-
62
-
63
-
64
-
65
-
66
-
67
-
68
-
69
-
70
-
71
-
72
-
73
-
74
-
75
-
76
-
77
-
78
-
79
-
80
-
81
-
82
-
83
-
84
-
85
-
86
-
87
-
88
-
89
-
90
-
91
-
92
-
93
-
94
-
95
-
96
-
97
-
98
-
99
-
100
-
101
-
102
-
103
-
104
-
105
-
106
 |
 |
28
impacted by approximately 14 bps from the 53rd week as a result of not including an additional week of fixed
expenses that are typically expensed in a 52-week year.
Operating Income
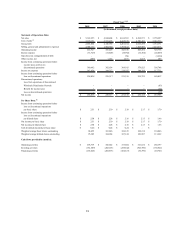
Operating income for fiscal 2008 was $414.9 million, or 8.1% of net sales, as compared to $416.4 million, or
8.6% of net sales, in fiscal 2007, or a decrease of 53 basis points. AAP produced operating income of $410.7
million, or 8.3% of net sales, for fiscal 2008 as compared to $417.2 million, or 8.9% of net sales, in fiscal 2007. AI
generated operating income for fiscal 2008 of $4.2 million as compared to an operating loss of $0.8 million in fiscal
2007. Operating income increased primarily due to AI’s positive sales results for the year and a decrease in payroll
expense as a percentage of sales. The Company’s overall operating income was reduced by a non-cash obsolete
inventory write-down of $37.5 million while results from the 53rd week contributed approximately $15.8 million to
our operating income.
Interest Expense
Interest expense for fiscal 2008 was $33.7 million, or 0.7% of net sales, as compared to $34.8 million, or 0.7%
of net sales, in fiscal 2007. The decrease in interest expense was a result of lower average borrowing rates partially
offset by higher average outstanding borrowings as compared to fiscal 2007.
Income Taxes
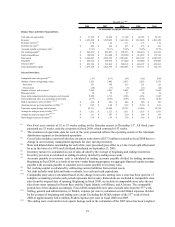
Income tax expense for fiscal 2008 was $142.7 million, as compared to $144.3 million for fiscal 2007. Our
effective income tax rate was 37.5% and 37.7% for fiscal 2008 and fiscal 2007, respectively.
Net Income & EPS
Net income for fiscal 2008 was $238.0 million, or $2.50 per diluted share, for fiscal 2008, as compared to
$238.3 million, or $2.28 per diluted share, for fiscal 2007. As a percentage of sales, net income for fiscal 2008 was
4.6%, as compared to 4.9% for fiscal 2007. The increase in diluted earnings per share was primarily due to a
reduced share count as a result of the shares repurchased during the last year. Net income and diluted earnings per
share were reduced by the non-cash obsolete inventory write-down of $23.7 million (net of tax) and $0.25,
respectively. Our results from the 53rd week contributed approximately $9.6 million of net income and earnings per
diluted share of $0.10.
Fiscal 2007 Compared to Fiscal 2006
Net Sales
Net sales for fiscal 2007 were $4,844.4 million, an increase of $227.9 million, or 4.9%, over net sales for fiscal
2006. The net sales increase was due to an increase in comparable store sales of 0.8% and contributions from the
196 AAP and AI stores opened within the prior year. The comparable store sales increase was driven by an increase
in average ticket sales and customer traffic in our Commercial business and an increase in average ticket sales by
our DIY customers offset by a decrease in DIY customer count. AI produced sales of $135.0 million in fiscal 2007,
an increase $23.9 million or 21.6%, compared to fiscal 2006. AI’s sales increase was driven primarily by our
acceleration of new-store growth through fiscal 2006 and 2007.
Gross Profit
Gross profit for fiscal 2007 was $2,321.0 million, or 47.9% of net sales, as compared to $2,201.2 million, or
47.7% of net sales, in fiscal 2006. The increase in gross profit as a percentage of net sales was due primarily to
improved procurement costs, a positive shift in sales mix and lower logistics expense partially offset by strategic
price changes associated with our focused effort on remaining competitive in the parts category.