Advance Auto Parts 2008 Annual Report Download - page 18
Download and view the complete annual report
Please find page 18 of the 2008 Advance Auto Parts annual report below. You can navigate through the pages in the report by either clicking on the pages listed below, or by using the keyword search tool below to find specific information within the annual report.-
 1
1 -
2
-
3
-
4
-
5
-
6
-
7
-
 8
8 -
 9
9 -
 10
10 -
 11
11 -
 12
12 -
 13
13 -
 14
14 -
 15
15 -
 16
16 -
 17
17 -
 18
18 -
 19
19 -
 20
20 -
 21
21 -
 22
22 -
 23
23 -
 24
24 -
 25
25 -
 26
26 -
 27
27 -
 28
28 -
29
-
30
-
31
-
32
-
33
-
34
-
35
-
36
-
37
-
38
-
39
-
40
-
41
-
42
-
43
-
44
-
45
-
46
-
47
-
48
-
49
-
50
-
51
-
52
-
53
-
54
-
55
-
56
-
57
-
58
-
59
-
60
-
61
-
62
-
63
-
64
-
65
-
66
-
67
-
68
-
69
-
70
-
71
-
72
-
73
-
74
-
75
-
76
-
77
-
78
-
79
-
80
-
81
-
82
-
83
-
84
-
85
-
86
-
87
-
88
-
89
-
90
-
91
-
92
-
93
-
94
-
95
-
96
-
97
-
98
-
99
-
100
-
101
-
102
-
103
-
104
-
105
-
106
 |
 |

4
Commercial Sales. Our commercial sales consist of sales to both our walk-in and delivery Commercial
customers, which represented approximately 27% of our AAP sales in fiscal 2008. Since 1996, we have aggressively
expanded our sales to Commercial customers through our Commercial delivery program. For delivered sales, we
utilize our Commercial delivery fleet to deliver product from our store locations to our Commercial customers’
place of business, including independent garages, service stations and auto dealers. Our stores are supported by a
Commercial sales team who are dedicated to the development of our Commercial customers, which include national
and regional accounts.
Under our Commercial Acceleration strategy, we are focused on increasing our Commercial sales at a faster
pace in light of the favorable market dynamics. The Commercial team is led by a senior vice president who is
building a sales force whose sole focus is on the Commercial customer. Initiatives include the addition of key
product brands in our stores that are well recognized by our Commercial customers, as well as increasing the parts
knowledge of our store Team Members. We believe these initiatives will enable us to gain more Commercial
customers as well as increase our sales from existing customers who will use us as their “first call” supplier. At
January 3, 2009, we had 2,755 AAP stores, or 85% of total AAP stores, with Commercial delivery programs, which
was up slightly from 83% at December 29, 2007.
Store Development. Our store development program has historically focused on adding new stores within
existing markets, remodeling or relocating existing stores and entering new markets. The addition of new stores,
along with strategic acquisitions, has played a significant role in our growth and success. We believe the opening of
new stores, and their strategic location in relation to our DIY and Commercial customers, will continue to play a
significant role in our future growth and success. Additionally, we will continue to monitor existing stores based on
cash flow, market importance and occupancy cost rates.
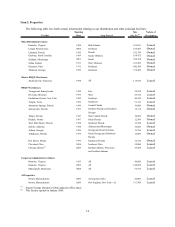
Our 3,243 AAP stores were located in the following states and territories at January 3, 2009:
Number of Number of Number of
Location Stores Location Stores Location Stores
Alabama 119 Maryland 72 Oklahoma 32
Arkansas 35 Massachusetts 54 Pennsylvania 158
Colorado 41 Michigan 91 Puerto Rico 27
Connecticut 36 Minnesota 16 Rhode Island 8
Delaware 7 Mississippi 58 South Carolina 125
Florida 457 Missouri 41 South Dakota 7
Georgia 229 Nebraska 20 Tennessee 142
Illinois 83 New Hampshire 11 Texas 177
Iowa 26 New Mexico 1 Vermont 7
Indiana 97 New Jersey 50 Virgin Islands 1
Kansas 24 New York 120 Virginia 167
Kentucky 91 North Carolina 234 West Virginia 66
Louisiana 61 North Dakota 4 Wisconsin 47
Maine 12 Ohio 186 Wyoming 3
The following table sets forth information concerning increases in the total number of our AAP stores during
the past five years:
2008 2007 2006 2005 2004
Beginning Stores 3,153 2,995 2,810 2,652 2,539
New Stores
(1)
109 175 190 169 125
Stores Closed (19) (17) (5) (11) (12)
Ending Stores
(2)
3,243 3,153 2,995 2,810 2,652