Advance Auto Parts 2008 Annual Report Download - page 93
Download and view the complete annual report
Please find page 93 of the 2008 Advance Auto Parts annual report below. You can navigate through the pages in the report by either clicking on the pages listed below, or by using the keyword search tool below to find specific information within the annual report.-
 1
1 -
2
-
3
-
4
-
5
-
6
-
7
-
8
-
9
-
10
-
11
-
12
-
13
-
14
-
15
-
16
-
17
-
18
-
19
-
20
-
21
-
22
-
23
-
24
-
25
-
26
-
27
-
28
-
29
-
30
-
31
-
32
-
33
-
34
-
35
-
36
-
37
-
38
-
39
-
40
-
41
-
42
-
43
-
44
-
45
-
46
-
47
-
48
-
49
-
50
-
51
-
52
-
53
-
54
-
55
-
56
-
57
-
58
-
59
-
60
-
61
-
62
-
63
-
64
-
65
-
66
-
67
-
68
-
69
-
70
-
71
-
72
-
73
-
74
-
75
-
76
-
77
-
78
-
79
-
80
-
81
-
82
-
 83
83 -
 84
84 -
 85
85 -
 86
86 -
 87
87 -
 88
88 -
 89
89 -
 90
90 -
 91
91 -
 92
92 -
 93
93 -
 94
94 -
 95
95 -
 96
96 -
 97
97 -
 98
98 -
 99
99 -
 100
100 -
 101
101 -
 102
102 -
 103
103 -
104
-
105
-
106
 |
 |

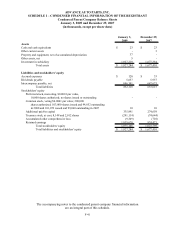
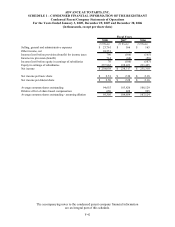
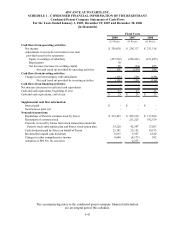
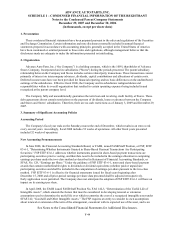
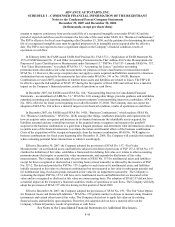
ADVANCE AUTO PARTS, INC. AND SUBSIDIARIES
NOTES TO THE CONSOLIDATED FINANCIAL STATEMENTS – (Continued)
January 3, 2009, December 29, 2007 and December 30, 2006
(in thousands, except per share data)
The accompanying notes to the consolidated financial statements
are an integral part of these statements.
F-39
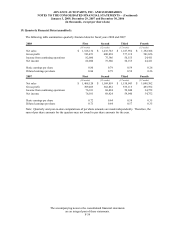
19. Quarterly Financial Data (unaudited):
The following table summarizes quarterly financial data for fiscal years 2008 and 2007:
2008 First Second Third Fourth
(16 weeks) (12 weeks) (12 weeks) (13 weeks)
Net sales 1,526,132$ 1,235,783$ 1,187,952$ 1,192,388$
Gross profit 743,451 600,838 577,119 541,656
Income from continuing operations 82,086 75,386 56,155 24,411
Net income 82,086 75,386 56,155 24,411
Basic earnings per share 0.86 0.79 0.59 0.26
Diluted earnings per share 0.86 0.79 0.59 0.26
2007 First Second Third Fourth
(16 weeks) (12 weeks) (12 weeks) (12 weeks)
Net sales 1,468,120$ 1,169,859$ 1,158,043$ 1,048,382$
Gross profit 709,403 562,861 555,113 493,592
Income from continuing operations 76,101 68,424 59,040 34,752
Net income 76,101 68,424 59,040 34,752
Basic earnings per share 0.72 0.64 0.58 0.35
Diluted earnings per share 0.71 0.64 0.57 0.35
Note: Quarterly and year-to-date computations of per share amounts are made independently. Therefore, the
sum of per share amounts for the quarters may not round to per share amounts for the year.