Advance Auto Parts 2008 Annual Report Download - page 43
Download and view the complete annual report
Please find page 43 of the 2008 Advance Auto Parts annual report below. You can navigate through the pages in the report by either clicking on the pages listed below, or by using the keyword search tool below to find specific information within the annual report.-
 1
1 -
2
-
3
-
4
-
5
-
6
-
7
-
8
-
9
-
10
-
11
-
12
-
13
-
14
-
15
-
16
-
17
-
18
-
19
-
20
-
21
-
22
-
23
-
24
-
25
-
26
-
27
-
28
-
29
-
30
-
31
-
32
-
 33
33 -
 34
34 -
 35
35 -
 36
36 -
 37
37 -
 38
38 -
 39
39 -
 40
40 -
 41
41 -
 42
42 -
 43
43 -
 44
44 -
 45
45 -
 46
46 -
 47
47 -
 48
48 -
 49
49 -
 50
50 -
 51
51 -
 52
52 -
 53
53 -
54
-
55
-
56
-
57
-
58
-
59
-
60
-
61
-
62
-
63
-
64
-
65
-
66
-
67
-
68
-
69
-
70
-
71
-
72
-
73
-
74
-
75
-
76
-
77
-
78
-
79
-
80
-
81
-
82
-
83
-
84
-
85
-
86
-
87
-
88
-
89
-
90
-
91
-
92
-
93
-
94
-
95
-
96
-
97
-
98
-
99
-
100
-
101
-
102
-
103
-
104
-
105
-
106
 |
 |

29
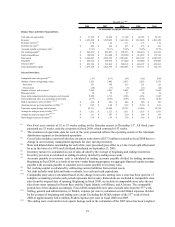
SG&A
SG&A expenses for fiscal 2007 were $1,904.5 million, or 39.3% of net sales, as compared to $1,797.8 million,
or 39.0% of net sales, for fiscal 2006. SG&A expenses increased as a percentage of sales primarily as a result of an
increase in certain fixed occupancy costs and lower than anticipated sales growth, partially offset by reduced
advertising expense.
Operating Income
Operating income for fiscal 2007 was $416.4 million, or 8.6% of net sales, as compared to $403.4 million, or
8.7% of net sales, in fiscal 2006. This decrease in operating income, as a percentage of net sales, was reflective of
higher selling, general and administrative expenses partially offset by an increase in gross profit. AAP produced
operating income of $417.2 million, or 8.9% of net sales, for fiscal 2007 as compared to $402.3 million, or 8.9% of
net sales, in fiscal 2006. AI generated an operating loss for fiscal 2007 of $0.8 million as compared to operating
income of $1.1 million in fiscal 2006. This decrease in operating income was primarily driven by lower than
anticipated sales, additional expenses associated with the transition to AI’s new distribution center early in fiscal
2007 and the reinvestment of resources to accelerate AI’s store growth and roll out of certain AI branded product.
Interest
Interest expense for fiscal 2007 was $34.8 million, or 0.7% of net sales, as compared to $36.0 million, or 0.8%
of net sales, in fiscal 2006. The decrease in interest expense was a result of lower average outstanding borrowings
and lower average borrowing rates as compared to fiscal 2006.
Income Taxes
Income tax expense for fiscal 2007 was $144.3 million, as compared to $138.6 million for fiscal 2006. Our
effective income tax rate was 37.7% and 37.5% for fiscal 2007 and 2006, respectively.
Net Income & EPS
We generated net income of $238.3 million, or $2.28 per diluted share, for fiscal 2007, as compared to $231.3
million, or $2.16 per diluted share, for fiscal 2006. As a percentage of sales, net income for fiscal 2007 was 4.9%, as
compared to 5.0% for fiscal 2006.
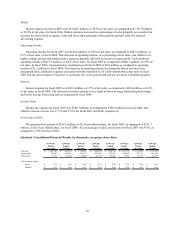
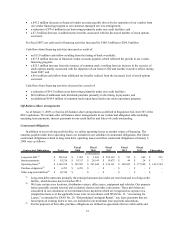
Quarterly Consolidated Financial Results (in thousands, except per share data)
16-Weeks 12-Weeks 12-Weeks 12-Weeks 16-Weeks 12-Weeks 12-Weeks 13-Weeks
Ended Ended Ended Ended Ended Ended Ended Ended
4/21/2007 7/14/2007 10/6/2007 12/29/2007 4/19/2008 7/12/2008 10/4/2008 1/3/2009
Net sales 1,468,120$ 1,169,859$ 1,158,043$ 1,048,382$ 1,526,132$ 1,235,783$ 1,187,952$ 1,192,388$
Gross profit 709,403 562,861 555,113 493,592 743,451 600,838 577,119 541,656
Net income 76,101 68,424 59,040 34,752 82,086 75,386 56,155 24,411
Net income per share:
Basic 0.72$ 0.64$ 0.58$ 0.35$ 0.86$ 0.79$ 0.59$ 0.26$
Diluted 0.71$ 0.64$ 0.57$ 0.35$ 0.86$ 0.79$ 0.59$ 0.26$