Advance Auto Parts 2008 Annual Report Download - page 92
Download and view the complete annual report
Please find page 92 of the 2008 Advance Auto Parts annual report below. You can navigate through the pages in the report by either clicking on the pages listed below, or by using the keyword search tool below to find specific information within the annual report.-
 1
1 -
2
-
3
-
4
-
5
-
6
-
7
-
8
-
9
-
10
-
11
-
12
-
13
-
14
-
15
-
16
-
17
-
18
-
19
-
20
-
21
-
22
-
23
-
24
-
25
-
26
-
27
-
28
-
29
-
30
-
31
-
32
-
33
-
34
-
35
-
36
-
37
-
38
-
39
-
40
-
41
-
42
-
43
-
44
-
45
-
46
-
47
-
48
-
49
-
50
-
51
-
52
-
53
-
54
-
55
-
56
-
57
-
58
-
59
-
60
-
61
-
62
-
63
-
64
-
65
-
66
-
67
-
68
-
69
-
70
-
71
-
72
-
73
-
74
-
75
-
76
-
77
-
78
-
79
-
80
-
81
-
 82
82 -
 83
83 -
 84
84 -
 85
85 -
 86
86 -
 87
87 -
 88
88 -
 89
89 -
 90
90 -
 91
91 -
 92
92 -
 93
93 -
 94
94 -
 95
95 -
 96
96 -
 97
97 -
 98
98 -
 99
99 -
 100
100 -
 101
101 -
 102
102 -
103
-
104
-
105
-
106
 |
 |

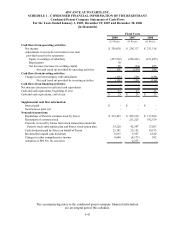
ADVANCE AUTO PARTS, INC. AND SUBSIDIARIES
NOTES TO THE CONSOLIDATED FINANCIAL STATEMENTS – (Continued)
January 3, 2009, December 29, 2007 and December 30, 2006
(in thousands, except per share data)
The accompanying notes to the consolidated financial statements
are an integral part of these statements.
F-38
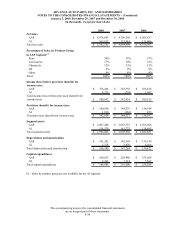
2008 2007 2006
Net Sales
AAP 4,976,603$ 4,709,390$ 4,505,437$
AI 165,652 135,014 111,066
Total net sales 5,142,255$ 4,844,404$ 4,616,503$
Percentage of Sales, by Product Group
in AAP Segment (1)
Parts 58% 57% 57%
Accessories 17% 18% 18%
Chemicals 12% 12% 12%
Oil 9% 9% 9%
Other 4% 4% 4%
Total 100% 100% 100%
Income (loss) before provision (benefit) for
income taxes
AAP 376,464$ 383,392$ 368,818$
AI 4,228 (758) 1,097
Total income (loss) before provision (benefit) for
income taxes 380,692$ 382,634$ 369,915$
Provision (benefit) for income taxes
AAP 140,838$ 144,579$ 138,144$
AI 1,816 (262) 453
Total provision (benefit) for income taxes 142,654$ 144,317$ 138,597$
Segment assets
AAP 2,807,486$ 2,663,791$ 2,565,986$
AI 156,579 141,775 116,695
Total segment assets 2,964,065$ 2,805,566$ 2,682,681$
Depreciation and amortization
AAP 141,202$ 142,194$ 135,159$
AI 5,378 5,070 4,264
Total depreciation and amortizatio
n
146,580$ 147,264$ 139,423$
Capital expenditures
AAP 180,623$ 203,486$ 251,024$
AI 4,363 7,114 7,562
Total capital expenditures 184,986$ 210,600$ 258,586$
(1) – Sales by product group are not available for the AI segment.