XM Radio 2011 Annual Report Download - page 94
Download and view the complete annual report
Please find page 94 of the 2011 XM Radio annual report below. You can navigate through the pages in the report by either clicking on the pages listed below, or by using the keyword search tool below to find specific information within the annual report.-
 1
1 -
2
-
3
-
4
-
5
-
6
-
7
-
8
-
9
-
10
-
11
-
12
-
13
-
14
-
15
-
16
-
17
-
18
-
19
-
20
-
21
-
22
-
23
-
24
-
25
-
26
-
27
-
28
-
29
-
30
-
31
-
32
-
33
-
34
-
35
-
36
-
37
-
38
-
39
-
40
-
41
-
42
-
43
-
44
-
45
-
46
-
47
-
48
-
49
-
50
-
51
-
52
-
53
-
54
-
55
-
56
-
57
-
58
-
59
-
60
-
61
-
62
-
63
-
64
-
65
-
66
-
67
-
68
-
69
-
70
-
71
-
72
-
73
-
74
-
75
-
76
-
77
-
78
-
79
-
80
-
81
-
82
-
83
-
 84
84 -
 85
85 -
 86
86 -
 87
87 -
 88
88 -
 89
89 -
 90
90 -
 91
91 -
 92
92 -
 93
93 -
 94
94 -
 95
95 -
 96
96 -
 97
97 -
 98
98 -
 99
99 -
 100
100 -
 101
101 -
 102
102 -
 103
103 -
 104
104 -
105
-
106
-
107
-
108
-
109
-
110
-
111
-
112
-
113
-
114
-
115
-
116
-
117
-
118
-
119
-
120
-
121
-
122
-
123
-
124
-
125
-
126
-
127
-
128
-
129
-
130
-
131
-
132
 |
 |

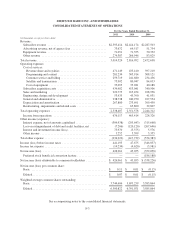
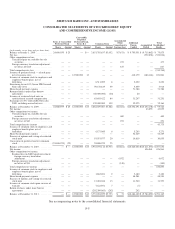
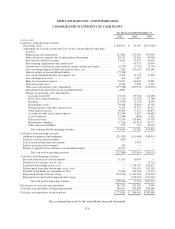
SIRIUS XM RADIO INC. AND SUBSIDIARIES
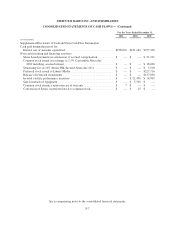
CONSOLIDATED STATEMENTS OF CASH FLOWS
For the Years Ended December 31,
2011 2010 2009
(in thousands)
Cash flows from operating activities:
Net income (loss) .................................................... $426,961 $ 43,055 $(352,038)
Adjustments to reconcile net income (loss) to net cash provided by operating
activities:
Depreciation and amortization ........................................ 267,880 273,691 309,450
Non-cash interest expense, net of amortization of premium ................. 39,515 42,841 43,066
Provision for doubtful accounts ....................................... 33,164 32,379 30,602
Restructuring, impairments and related costs ............................ — 66,731 26,964
Amortization of deferred income related to equity method investment......... (2,776) (2,776) (2,776)
Loss on extinguishment of debt and credit facilities, net .................... 7,206 120,120 267,646
Gain on merger of unconsolidated entities ............................... (75,768) — —
Loss on unconsolidated entity investments, net ........................... 6,520 11,722 13,664
Loss on disposal of assets ............................................ 269 1,017 —
Share-based payment expense ........................................ 53,190 60,437 73,981
Deferred income taxes .............................................. 8,264 2,308 4,359
Other non-cash purchase price adjustments .............................. (275,338) (250,727) (202,054)
Distribution from investment in unconsolidated entity ..................... 4,849 — —
Changes in operating assets and liabilities:
Accounts receivable .............................................. (13,211) (39,236) (42,158)
Receivables from distributors ....................................... (17,241) (11,023) (2,788)
Inventory ...................................................... (14,793) (5,725) 8,269
Related party assets .............................................. 30,036 (9,803) 15,305
Prepaid expenses and other current assets ............................. 8,525 75,374 10,027
Other long-term assets ............................................ 36,490 17,671 86,674
Accounts payable and accrued expenses .............................. (32,010) 5,420 (46,645)
Accrued interest ................................................. (2,048) (884) 2,429
Deferred revenue ................................................ 55,336 133,444 93,578
Related party liabilities ............................................ (1,542) (53,413) 50,172
Other long-term liabilities ......................................... 152 272 46,103
Net cash provided by operating activities ........................... 543,630 512,895 433,830
Cash flows from investing activities:
Additions to property and equipment ..................................... (137,429) (311,868) (248,511)
Purchase of restricted investments ....................................... (826) — —
Sale of restricted and other investments ................................... — 9,454 —
Release of restricted investments ........................................ 250 — —
Return of capital from investment in unconsolidated entity ................... 10,117 — —
Net cash used in investing activities ............................... (127,888) (302,414) (248,511)
Cash flows from financing activities:
Proceeds from exercise of stock options .................................. 11,553 10,839 —
Preferred stock issuance, net of costs ..................................... — — (3,712)
Long-term borrowings, net of costs ...................................... — 1,274,707 582,612
Related party long-term borrowings, net of costs ........................... — 196,118 362,593
Payment of premiums on redemption of debt .............................. (5,020) (84,326) (17,075)
Repayment of long-term borrowings ..................................... (234,976) (1,262,396) (755,447)
Repayment of related party long-term borrowings .......................... — (142,221) (351,247)
Net cash used in financing activities ............................... (228,443) (7,279) (182,276)
Net increase in cash and cash equivalents ................................... 187,299 203,202 3,043
Cash and cash equivalents at beginning of period ............................. 586,691 383,489 380,446
Cash and cash equivalents at end of period .................................. $773,990 $ 586,691 $ 383,489
See accompanying notes to the consolidated financial statements.
F-6