XM Radio 2011 Annual Report Download - page 67
Download and view the complete annual report
Please find page 67 of the 2011 XM Radio annual report below. You can navigate through the pages in the report by either clicking on the pages listed below, or by using the keyword search tool below to find specific information within the annual report.-
 1
1 -
2
-
3
-
4
-
5
-
6
-
7
-
8
-
9
-
10
-
11
-
12
-
13
-
14
-
15
-
16
-
17
-
18
-
19
-
20
-
21
-
22
-
23
-
24
-
25
-
26
-
27
-
28
-
29
-
30
-
31
-
32
-
33
-
34
-
35
-
36
-
37
-
38
-
39
-
40
-
41
-
42
-
43
-
44
-
45
-
46
-
47
-
48
-
49
-
50
-
51
-
52
-
53
-
54
-
55
-
56
-
 57
57 -
 58
58 -
 59
59 -
 60
60 -
 61
61 -
 62
62 -
 63
63 -
 64
64 -
 65
65 -
 66
66 -
 67
67 -
 68
68 -
 69
69 -
 70
70 -
 71
71 -
 72
72 -
 73
73 -
 74
74 -
 75
75 -
 76
76 -
 77
77 -
78
-
79
-
80
-
81
-
82
-
83
-
84
-
85
-
86
-
87
-
88
-
89
-
90
-
91
-
92
-
93
-
94
-
95
-
96
-
97
-
98
-
99
-
100
-
101
-
102
-
103
-
104
-
105
-
106
-
107
-
108
-
109
-
110
-
111
-
112
-
113
-
114
-
115
-
116
-
117
-
118
-
119
-
120
-
121
-
122
-
123
-
124
-
125
-
126
-
127
-
128
-
129
-
130
-
131
-
132
 |
 |
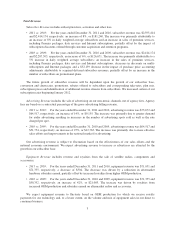
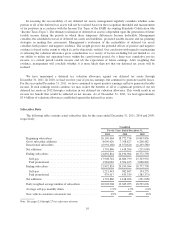
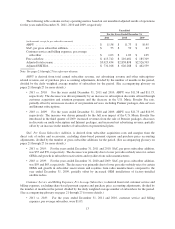
Subscribers. At December 31, 2011, we had 21,892,824 subscribers, an increase of 1,701,860 subscribers, or 8%,
from the 20,190,964 subscribers as of December 31, 2010.
•2011 vs. 2010: For the years ended December 31, 2011 and 2010, net additions were 1,701,860 and 1,418,206,
respectively, an increase in net additions of 20%, or 283,654. The improvement is due to the 12% increase in gross
subscriber additions, primarily resulting from an increase in U.S. light vehicle sales, new vehicle penetration, and
returning subscriber activations inclusive of previously owned car acquisitions. This increase in gross additions was
partially offset by the 10% increase in deactivations, which was primarily due to an increase in paid promotional trial
volumes along with growth in our subscriber base.
•2010 vs. 2009: For the years ended December 31, 2010 and 2009, net additions were 1,418,206 and (231,098),
respectively, an increase in net additions of 1,649,304. The improvement was due to the 25% increase in gross
subscriber additions, primarily resulting from an increase in U.S. light vehicle sales, new vehicle penetration and
returning subscriber activations.
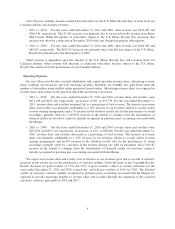
Average Self-pay Monthly Churn is derived by dividing the monthly average of self-pay deactivations for the quarter by
the average self-pay subscriber balance for the quarter. (See accompanying glossary on pages 45 through 51 for more
details.)
•2011 vs. 2010: For the years ended December 31, 2011 and 2010, our average self-pay monthly churn rate was
1.9%. The consistent churn rate exhibits stability in the continued demand for and satisfaction with our service from
existing subscribers.
•2010 vs. 2009: For the years ended December 31, 2010 and 2009, our average self-pay monthly churn rate was
1.9% and 2.0%, respectively. The decrease was due to an improving economy, the success of retention and win-back
programs and reductions in non-pay cancellation rates.
New Vehicle Consumer Conversion Rate is the percentage of owners and lessees of new vehicles that receive our service
and convert to become self-paying subscribers after an initial promotional period. The metric excludes rental and fleet
vehicles. (See accompanying glossary on pages 45 through 51 for more details).
•2011 vs. 2010: For the years ended December 31, 2011 and 2010, the new vehicle consumer conversion rate was
45% and 46%, respectively. The decrease was primarily due to the changing mix of sales among OEMs and
operational issues impacting the timing of the receipt of customer information and prompt marketing communications
with buyers and lessees of vehicles.
•2010 vs. 2009: For the years ended December 31, 2010 and 2009, the new vehicle consumer conversion rate was
46% and 45%, respectively. The increase was primarily due to improved marketing to promotional period subscribers
and an improving economy.
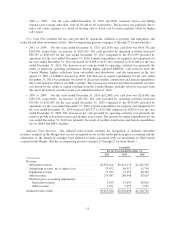
The discussion of operating results below excludes the effects of stock-based compensation and purchase price
accounting adjustments associated with the Merger. Financial measures and metrics previously reported as “pro forma” have
been renamed “adjusted.”
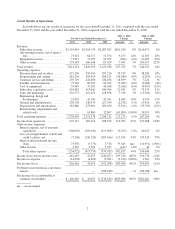
Adjusted Results of Operations
In this section, we present certain financial performance measures that are not calculated and presented in accordance
with generally accepted accounting principles in the United States of America (“Non-GAAP”). These Non-GAAP financial
measures include: average monthly revenue per subscriber, or ARPU; subscriber acquisition cost, or SAC, per gross
subscriber addition; customer service and billing expenses, per average subscriber; free cash flow; adjusted total revenue; and
adjusted EBITDA. These measures exclude the impact of certain purchase price accounting adjustments. We use these
Non-GAAP financial measures to manage our business, set operational goals and as a basis for determining performance-
based compensation for our employees.
The purchase price accounting adjustments include the elimination of the earnings benefit of deferred revenue
associated with our investment in Sirius XM Canada, the recognition of subscriber revenues not recognized in purchase price
accounting and the elimination of the earnings benefit of deferred credits on executory contracts, which are primarily
attributable to third party arrangements with an OEM and programming providers.
11