XM Radio 2011 Annual Report Download - page 61
Download and view the complete annual report
Please find page 61 of the 2011 XM Radio annual report below. You can navigate through the pages in the report by either clicking on the pages listed below, or by using the keyword search tool below to find specific information within the annual report.-
 1
1 -
2
-
3
-
4
-
5
-
6
-
7
-
8
-
9
-
10
-
11
-
12
-
13
-
14
-
15
-
16
-
17
-
18
-
19
-
20
-
21
-
22
-
23
-
24
-
25
-
26
-
27
-
28
-
29
-
30
-
31
-
32
-
33
-
34
-
35
-
36
-
37
-
38
-
39
-
40
-
41
-
42
-
43
-
44
-
45
-
46
-
47
-
48
-
49
-
50
-
 51
51 -
 52
52 -
 53
53 -
 54
54 -
 55
55 -
 56
56 -
 57
57 -
 58
58 -
 59
59 -
 60
60 -
 61
61 -
 62
62 -
 63
63 -
 64
64 -
 65
65 -
 66
66 -
 67
67 -
 68
68 -
 69
69 -
 70
70 -
 71
71 -
72
-
73
-
74
-
75
-
76
-
77
-
78
-
79
-
80
-
81
-
82
-
83
-
84
-
85
-
86
-
87
-
88
-
89
-
90
-
91
-
92
-
93
-
94
-
95
-
96
-
97
-
98
-
99
-
100
-
101
-
102
-
103
-
104
-
105
-
106
-
107
-
108
-
109
-
110
-
111
-
112
-
113
-
114
-
115
-
116
-
117
-
118
-
119
-
120
-
121
-
122
-
123
-
124
-
125
-
126
-
127
-
128
-
129
-
130
-
131
-
132
 |
 |
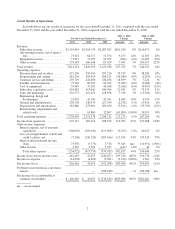
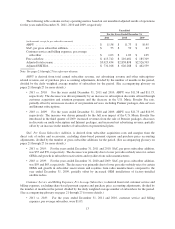
Programming and Content includes costs to acquire, create, promote and produce content. We have entered
into various agreements with third parties for music and non-music programming that require us to pay license
fees, purchase advertising on media properties owned or controlled by the licensor and pay other guaranteed
amounts.
•2011 vs. 2010: For the years ended December 31, 2011 and 2010, programming and content expenses
were $281,234 and $305,914, respectively, a decrease of 8%, or $24,680 and decreased as a percentage of
total revenue. The decrease was primarily due to savings in content agreements and production costs,
partially offset by increases in personnel costs and an $8,394 reduction in the benefit to earnings from
purchase price accounting adjustments associated with the Merger attributable to the amortization of the
deferred credit on acquired programming executory contracts.
•2010 vs. 2009: For the years ended December 31, 2010 and 2009, programming and content expenses
were $305,914 and $308,121, respectively, a decrease of 1%, or $2,207 and decreased as a percentage of
total revenue. The decrease was primarily due to savings in content agreements and production costs,
partially offset by increases in personnel costs, general operating expenses and a $14,503 reduction in the
benefit to earnings from purchase price accounting adjustments associated with the Merger attributable to
the amortization of the deferred credit on acquired programming executory contracts.
Based on our current programming offerings, we expect our programming and content expenses to decrease
as agreements expire and are renewed or replaced on more cost effective terms. The impact of purchase price
accounting adjustments associated with the Merger attributable to the amortization of the deferred credit on
acquired programming executory contracts will continue to decline, in absolute amount and as a percentage of
reported programming and content costs, through 2013.
Customer Service and Billing includes costs associated with the operation and management of third party
customer service centers, and our subscriber management systems as well as billing and collection costs,
transaction fees and bad debt expense.
•2011 vs. 2010: For the years ended December 31, 2011 and 2010, customer service and billing
expenses were $259,719 and $241,680, respectively, an increase of 7%, or $18,039 and remained flat as a
percentage of total revenue. The increase was primarily attributable to an 8% increase in daily weighted
average subscribers which drove higher call volume, billing and collection costs, transaction fees, as well
as increased handle time per call and personnel costs. This increase was partially offset by lower agent
rates, fewer contacts per subscriber and lower general operating costs.
•2010 vs. 2009: For the years ended December 31, 2010 and 2009, customer service and billing
expenses were $241,680 and $234,456, respectively, an increase of 3%, or $7,224 but decreased as a
percentage of total revenue. The increase was primarily due to higher call volume driven by an increase in
average subscribers and more contacts per subscriber, partially offset by lower handle time per call and
lower agent cost as a result of moving calls to lower cost locations.
We expect our customer care and billing expenses to increase as our subscriber base grows.
Satellite and Transmission consists of costs associated with the operation and maintenance of our satellites;
satellite telemetry, tracking and control systems; terrestrial repeater networks; satellite uplink facilities; broadcast
studios; and delivery of our Internet service.
•2011 vs. 2010: For the years ended December 31, 2011 and 2010, satellite and transmission expenses
were $75,902 and $80,947, respectively, a decrease of 6%, or $5,045 and decreased as a percentage of
total revenue. The decrease was due to savings in repeater expenses from network optimization along
with favorable lease renewals, a reduction in satellite in-orbit insurance expense, and a transition to more
cost-effective approaches to satellite and broadcast operations.
•2010 vs. 2009: For the years ended December 31, 2010 and 2009, satellite and transmission expenses
were $80,947 and $84,033, respectively, a decrease of 4%, or $3,086 and decreased as a percentage of
total revenue. The decrease was primarily due to savings in repeater expenses, partially offset by
increased satellite insurance costs related to our FM-5 satellite.
5